!

Maps from a New EPA Study on Sea Level Rise and the Mid-Atlantic Coast

Elevation maps of entire states

!

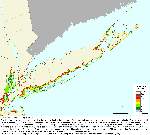
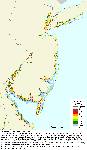
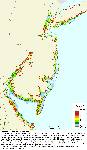
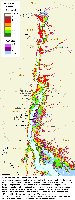
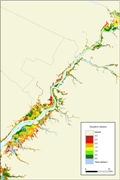
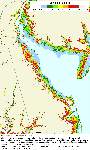
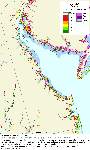
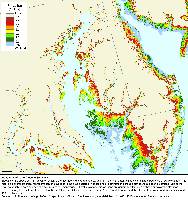
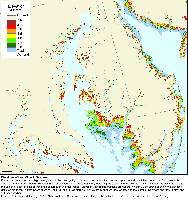
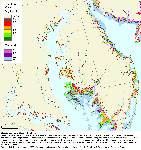
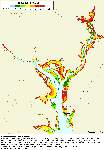
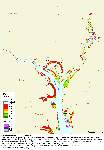
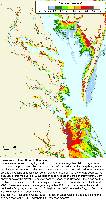
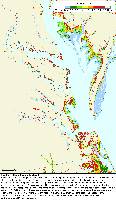
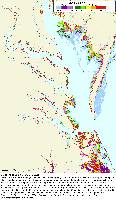
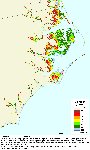
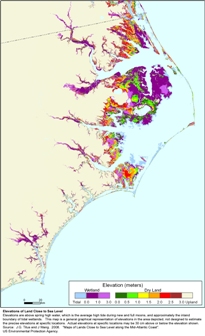
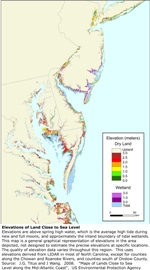
A multi-year project by the US Environmental Protection Agency (Titus and Wang 2008) created maps to illustrate vulnerability to sea level rise, using existing data.  A draft report on sea level rise by the US Climate Change Research Program used the EPA data set to create multi-county maps, which we post here. The maps show elevations relative to spring high water, the average tide during new and full moons. The accuracy of the data varies, so we have also included an index map showing the data sources.

These maps are in jpg files designed for printing at 300 dots per inch on 8-1/2 X 11 inch paper. If you simply click on the links below and try to read them on your computer screen, some of them may look strange, depending on your internet browser. If so, please save the jpg map onto your computer's hard drive and then open the file with the program you normally use to read jpg files.


New York, 1-meter contour interval


New York
1-meter contour

New Jersey, 50-cm contour


New Jersey
50-cm contour
with nontidal
wetlands

New Jersey, 1-meter contour, various data sources 


New Jersey
1-meter contour

Pennsylvania 


Pennsylvania
i.e. Delaware River
1-meter contour

Delaware River:  Vulnerability to sea level rise
Pennsylvania
i.e. Delaware River
1-m contour
with nontidal wetlands

Delaware


<


Delaware
1-meter contour interval

Delaware River:  Vulnerability to sea level rise 


Delaware River

Delaware 50-cm contour interval


Delaware
50-cm contour interval
 

Maryland Sea Level Rise Map, 1 meter contour interval 


Maryland
1-meter contour

Maryland, 50-cm contour 


Maryland
50-cm contour

Maryland 50 cm with nontidal wetlands 


Maryland: 50-cm contour
with nontidal wetlands

llll


District of Columbia
1-meter contour


District of Columbia
50-cm meter contour

Virginia sea level rise map, 1-meter contour 


Virginia: 1-meter contour

Virginia 50-cm contour with nontidal wetlands 


Virginia: 50-cm contour


Virginia 50-cm contour
with nontidal wetlands


North Carolina
50-cm contour

North Carolina, 1-meter contour, using LIDAR


North Carolina
1-m contour


North Carolina
to New York
1-m contour


Data Source
Index
Map