!

Sea Level Rise Maps for Pennsylvania

!
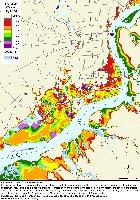
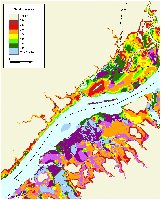
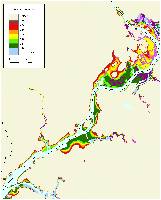
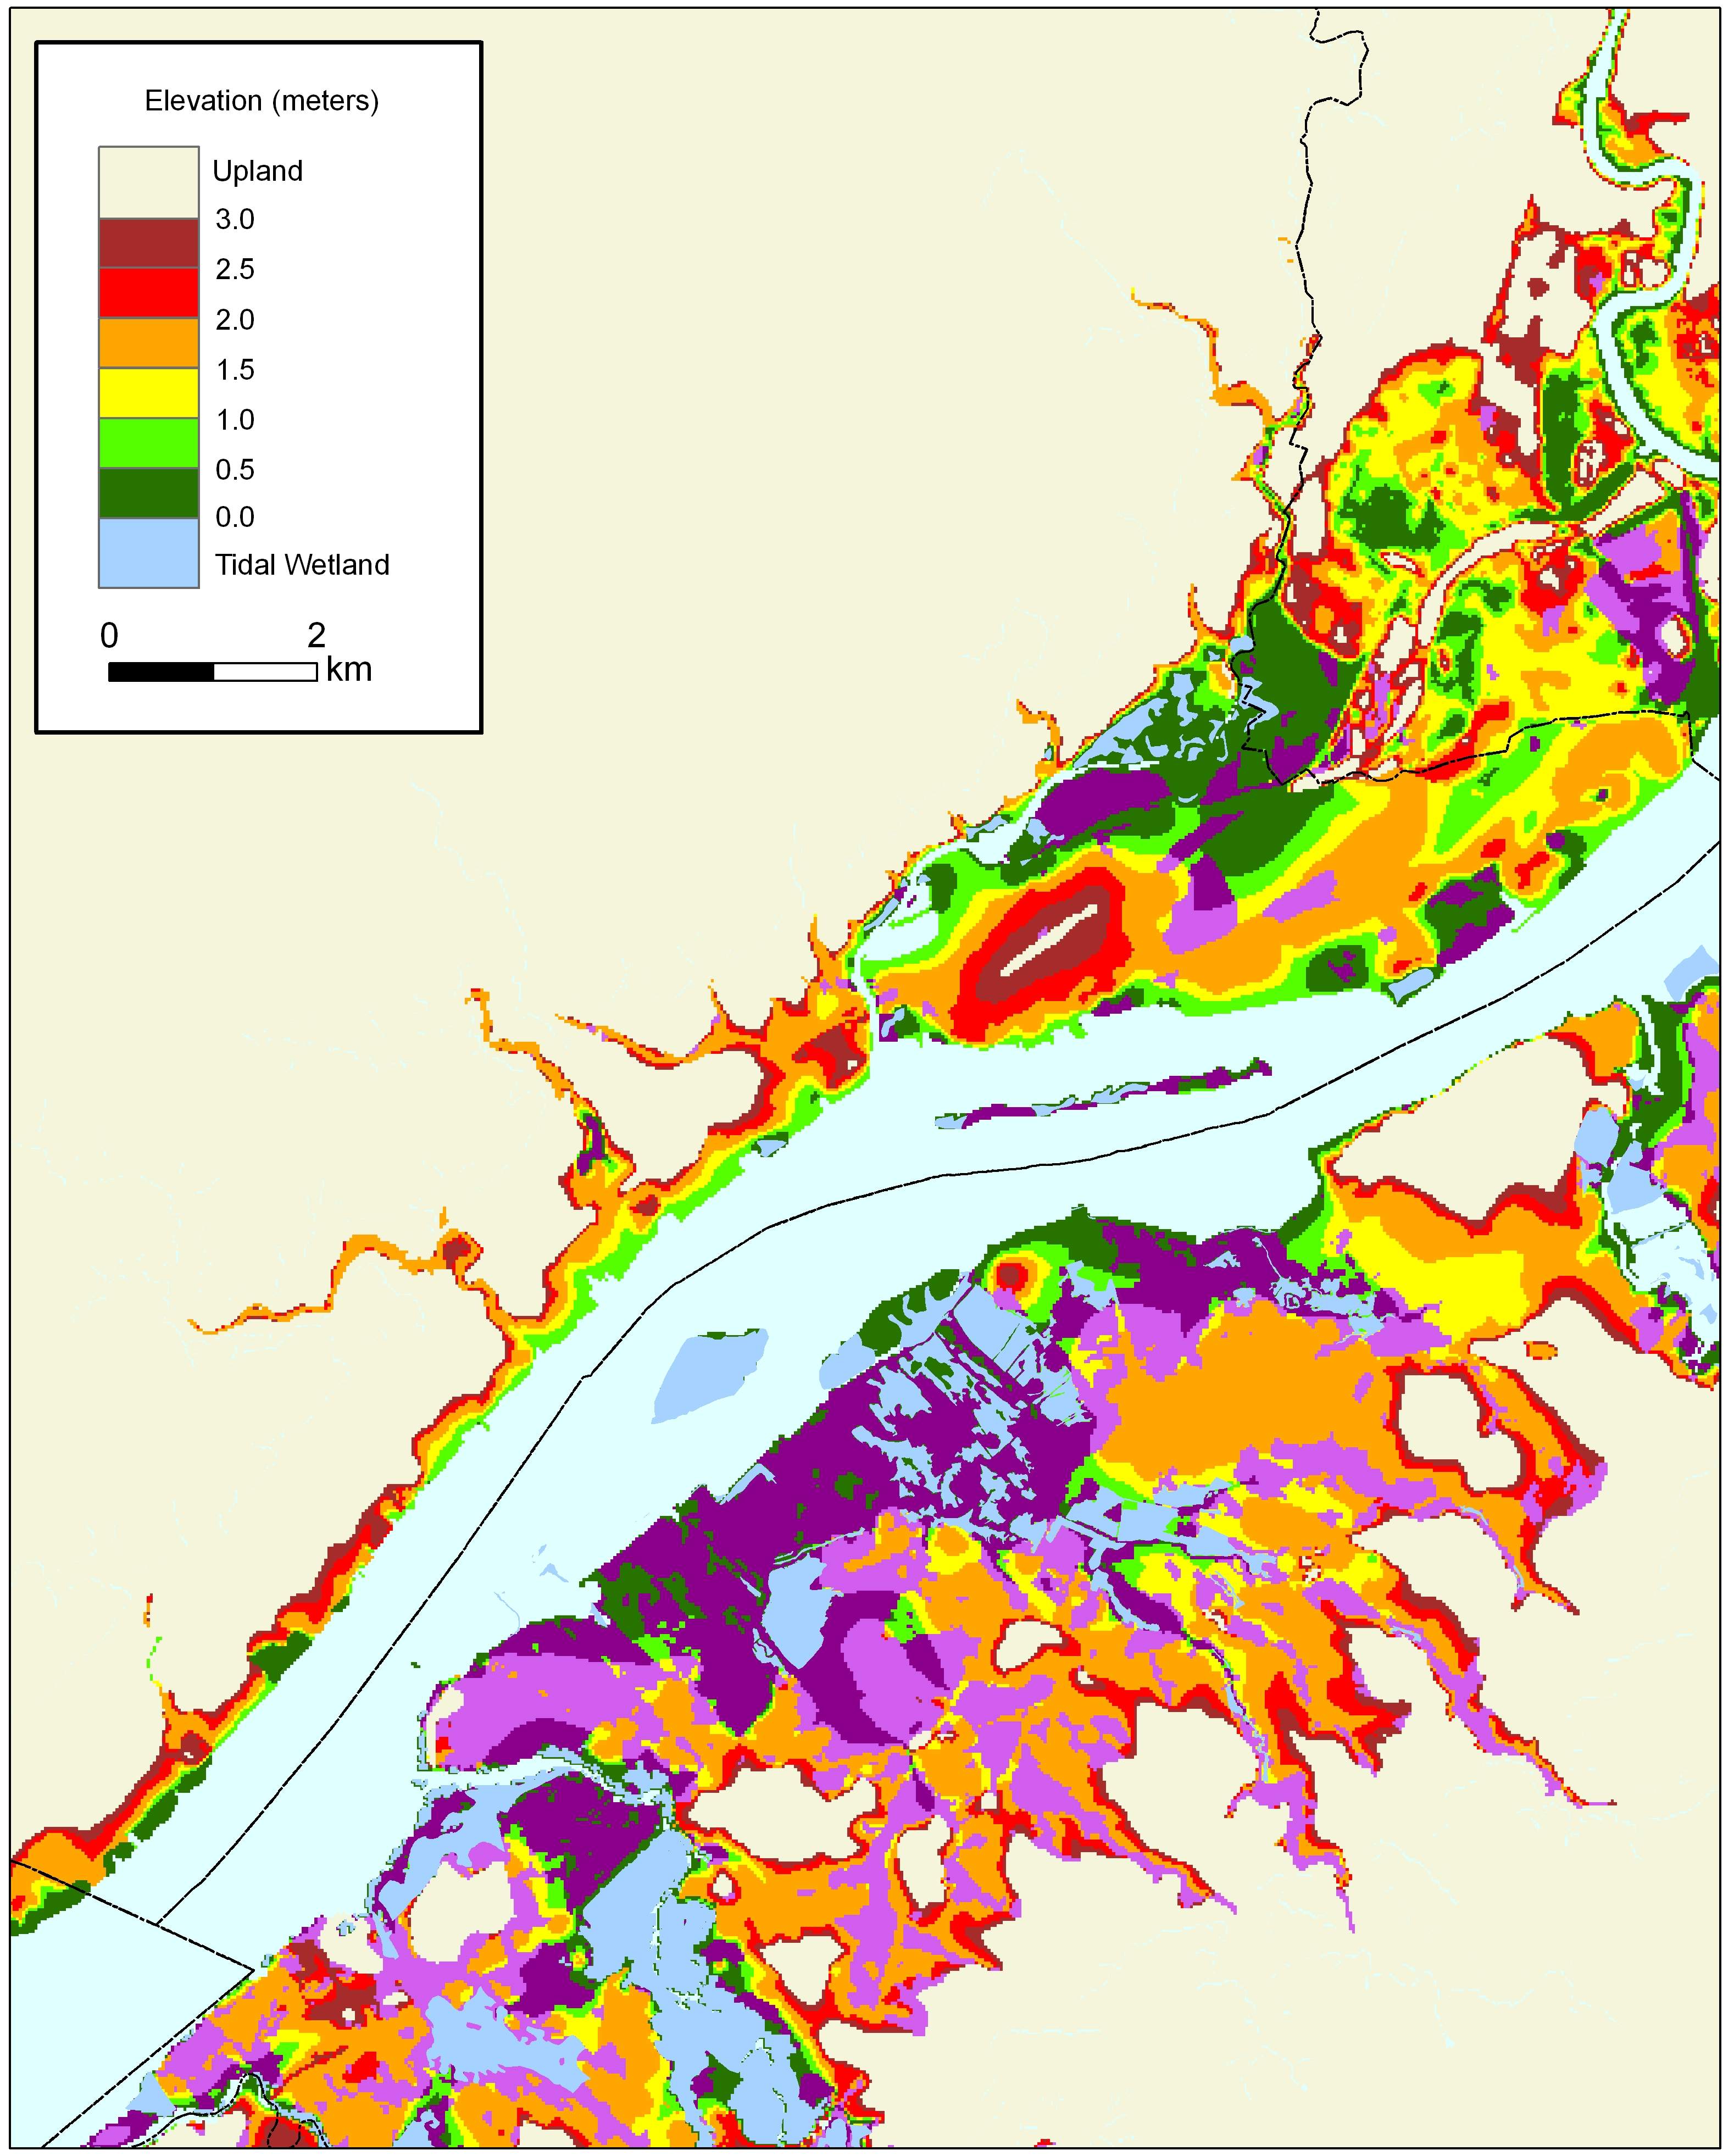
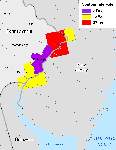
Most of these maps are drawn from an EPA study, which developed county-scale elevation maps to illustrate vulnerability to sea level rise, using existing data--including 2-ft contour data provided by the City of Philadelphia. The maps show elevations relative to spring high water, the average tide during new and full moons. The accuracy of the data varies, so we have also included an index map showing the data sources, which can help you figure out how accurate our maps are for a particular location.

Philadelphia vulnerability to sea level rise
Philadelphia

Pennsylvania 


Delaware River
1-meter contour

Delaware River:  Vulnerability to sea level rise


Delaware River
50-cm contour

Delaware River:  Vulnerability to sea level rise


Delaware County: 50-cm contour
Caution: The 50-cm contours are model output
Titus and Wang (2008) recommend a 1-meter
contour for this county

Delaware River:  Vulnerability to sea level rise


Bucks County: 50-cm contour
Caution: The 50-cm contours are model output
Titus and Wang (2008) recommend
a 1.5- or 2-meter contour for this county


Data Quality Index Map 


Data Quality
Index Map