!

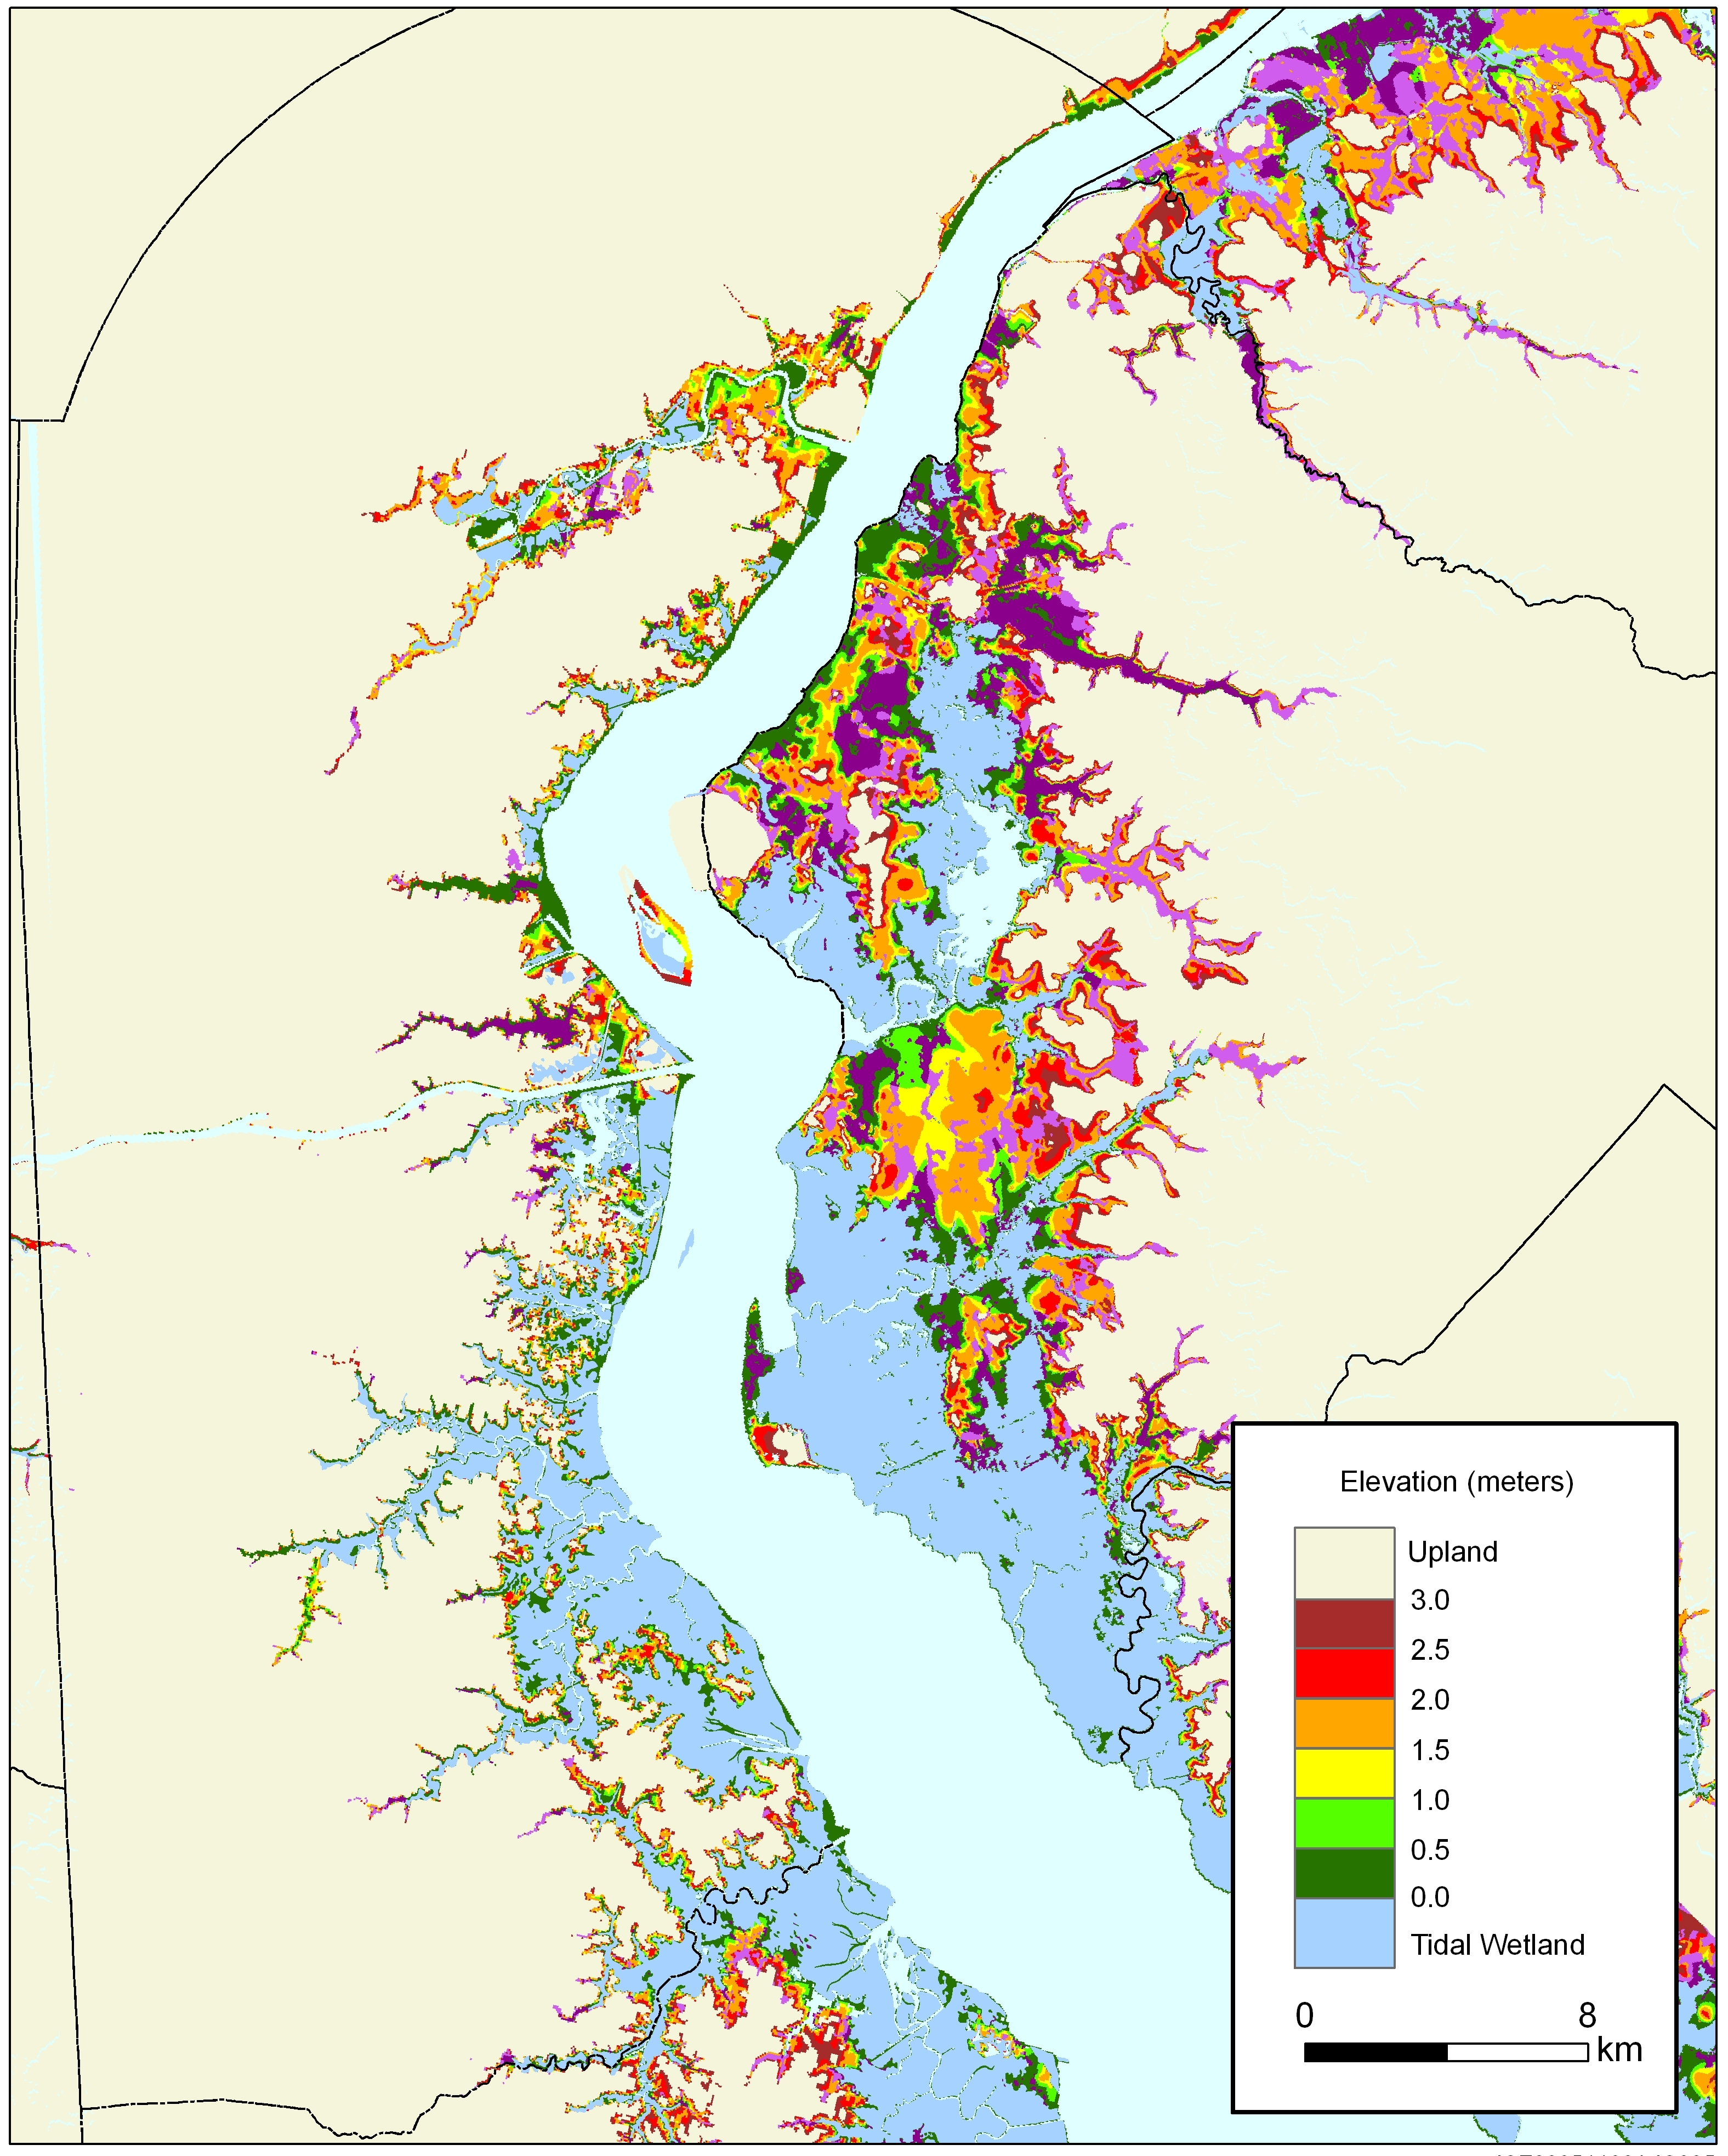
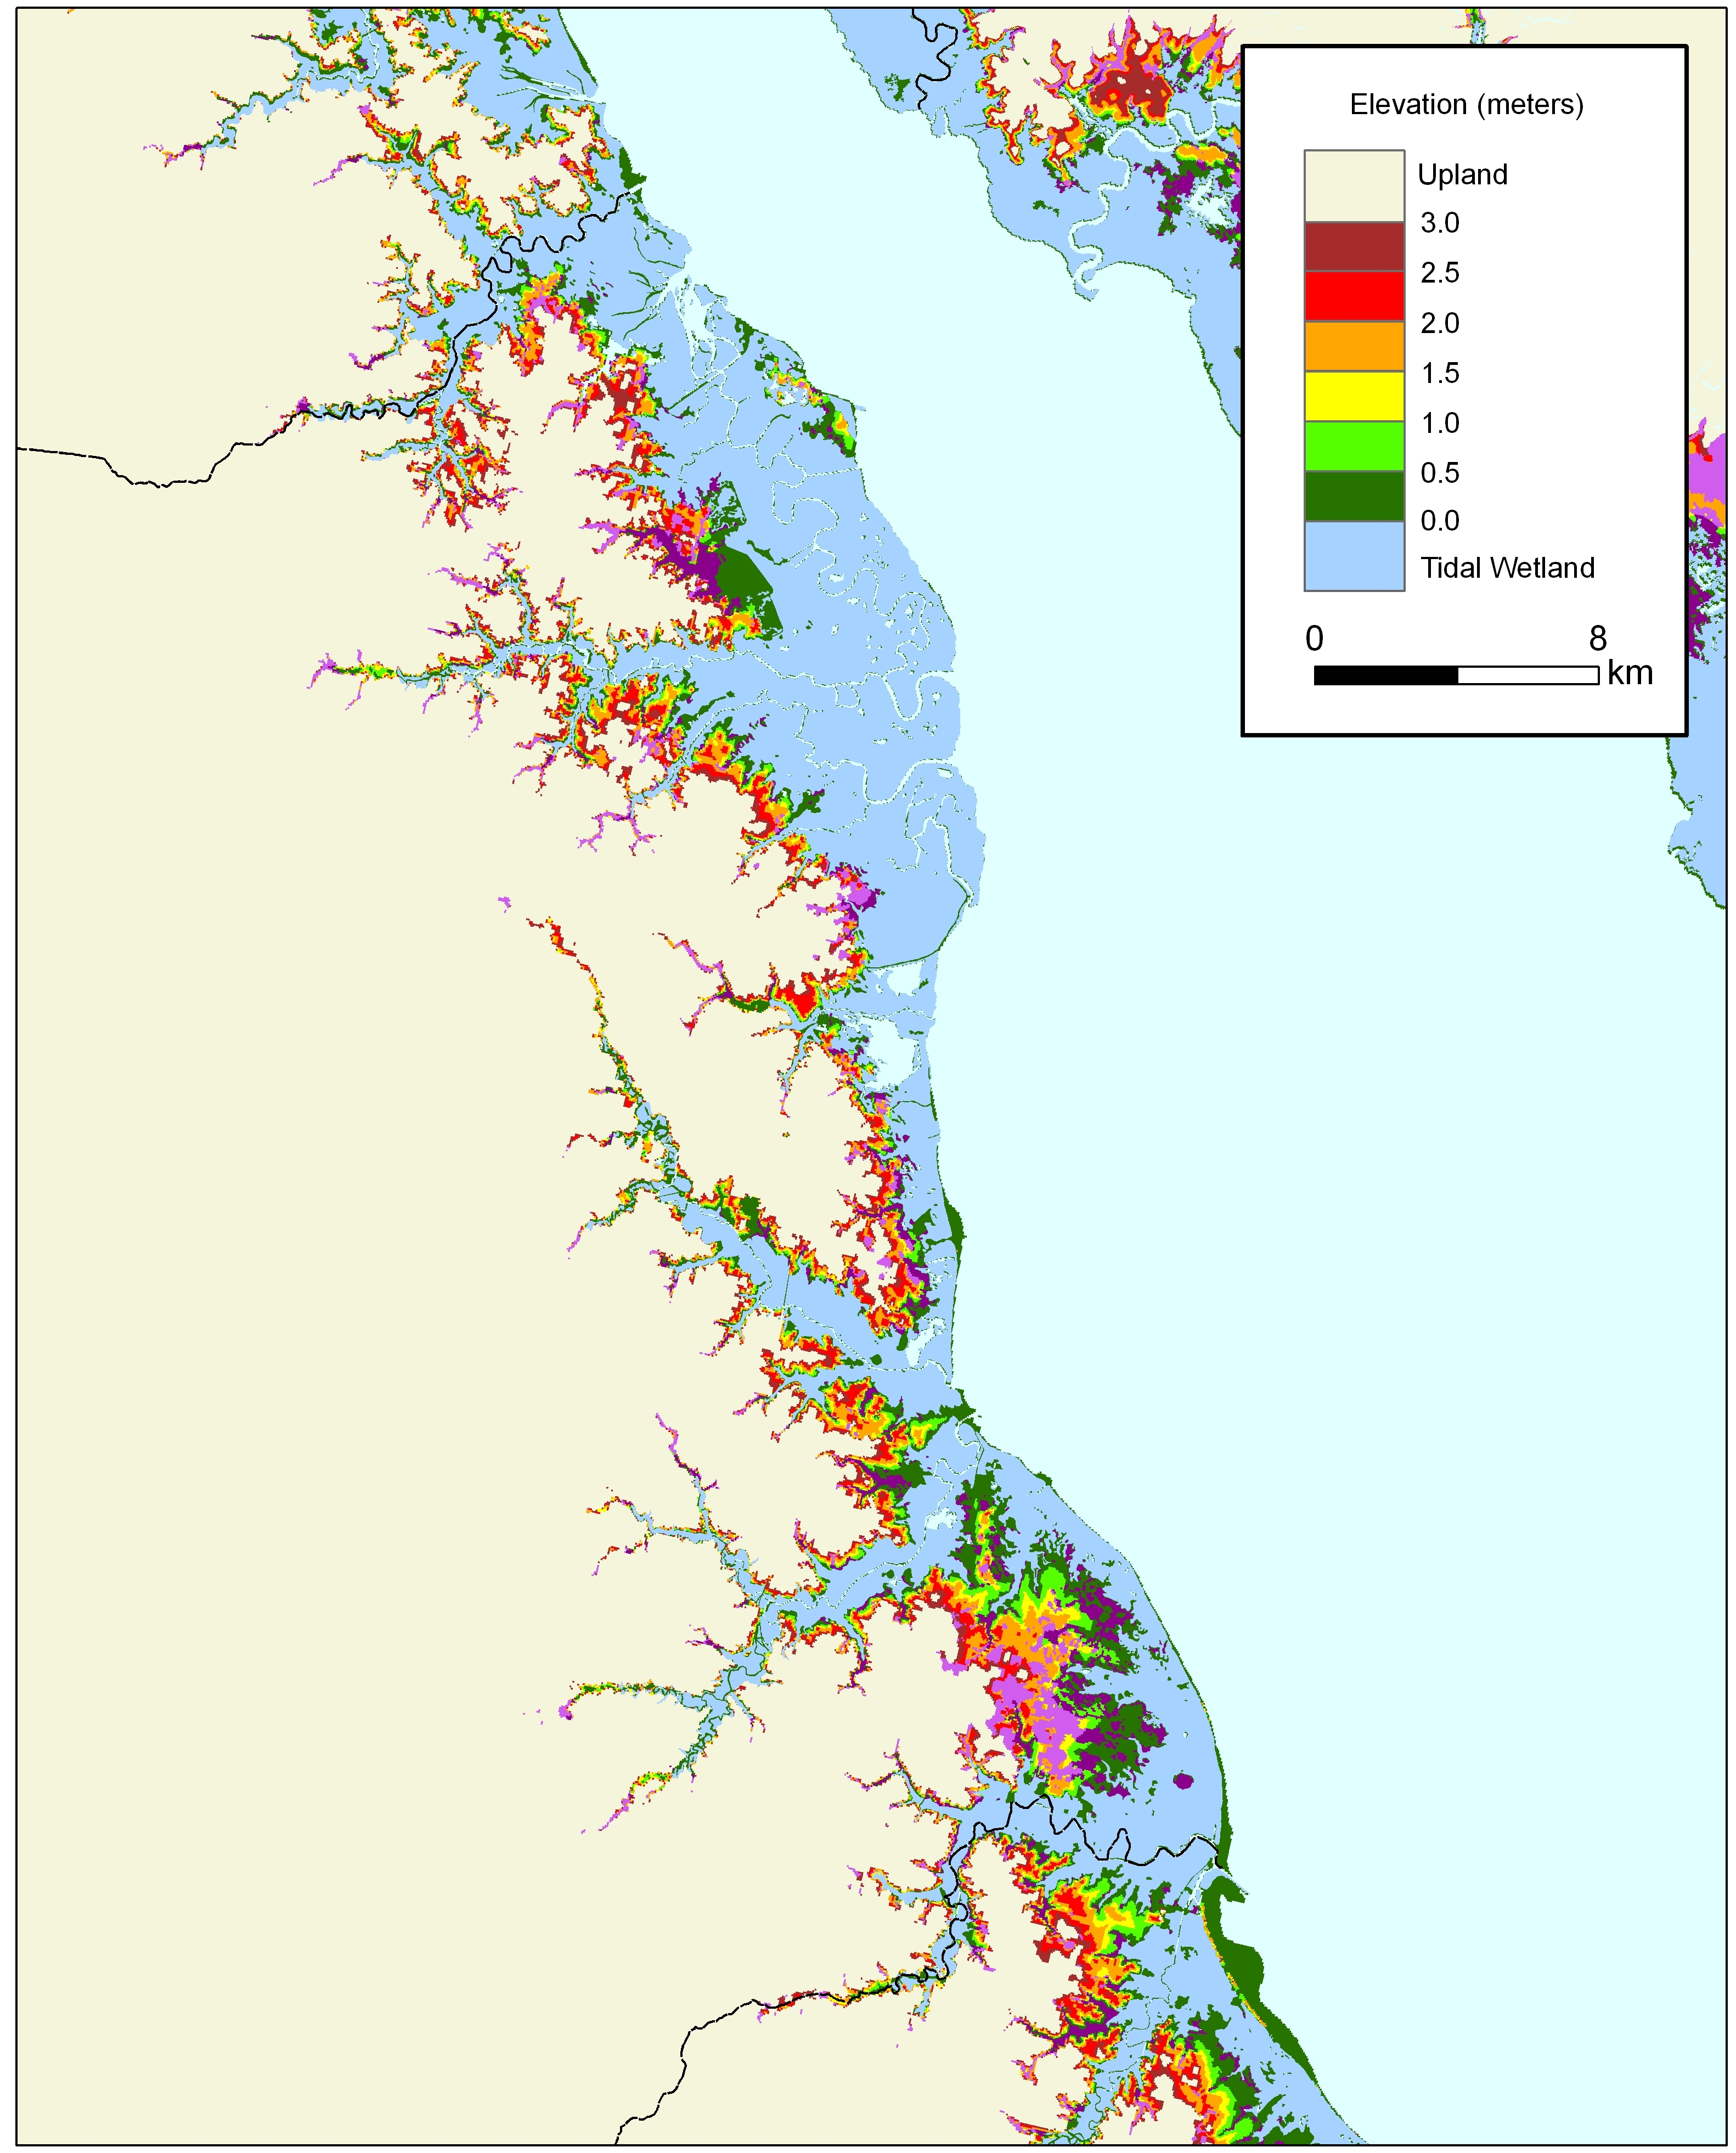
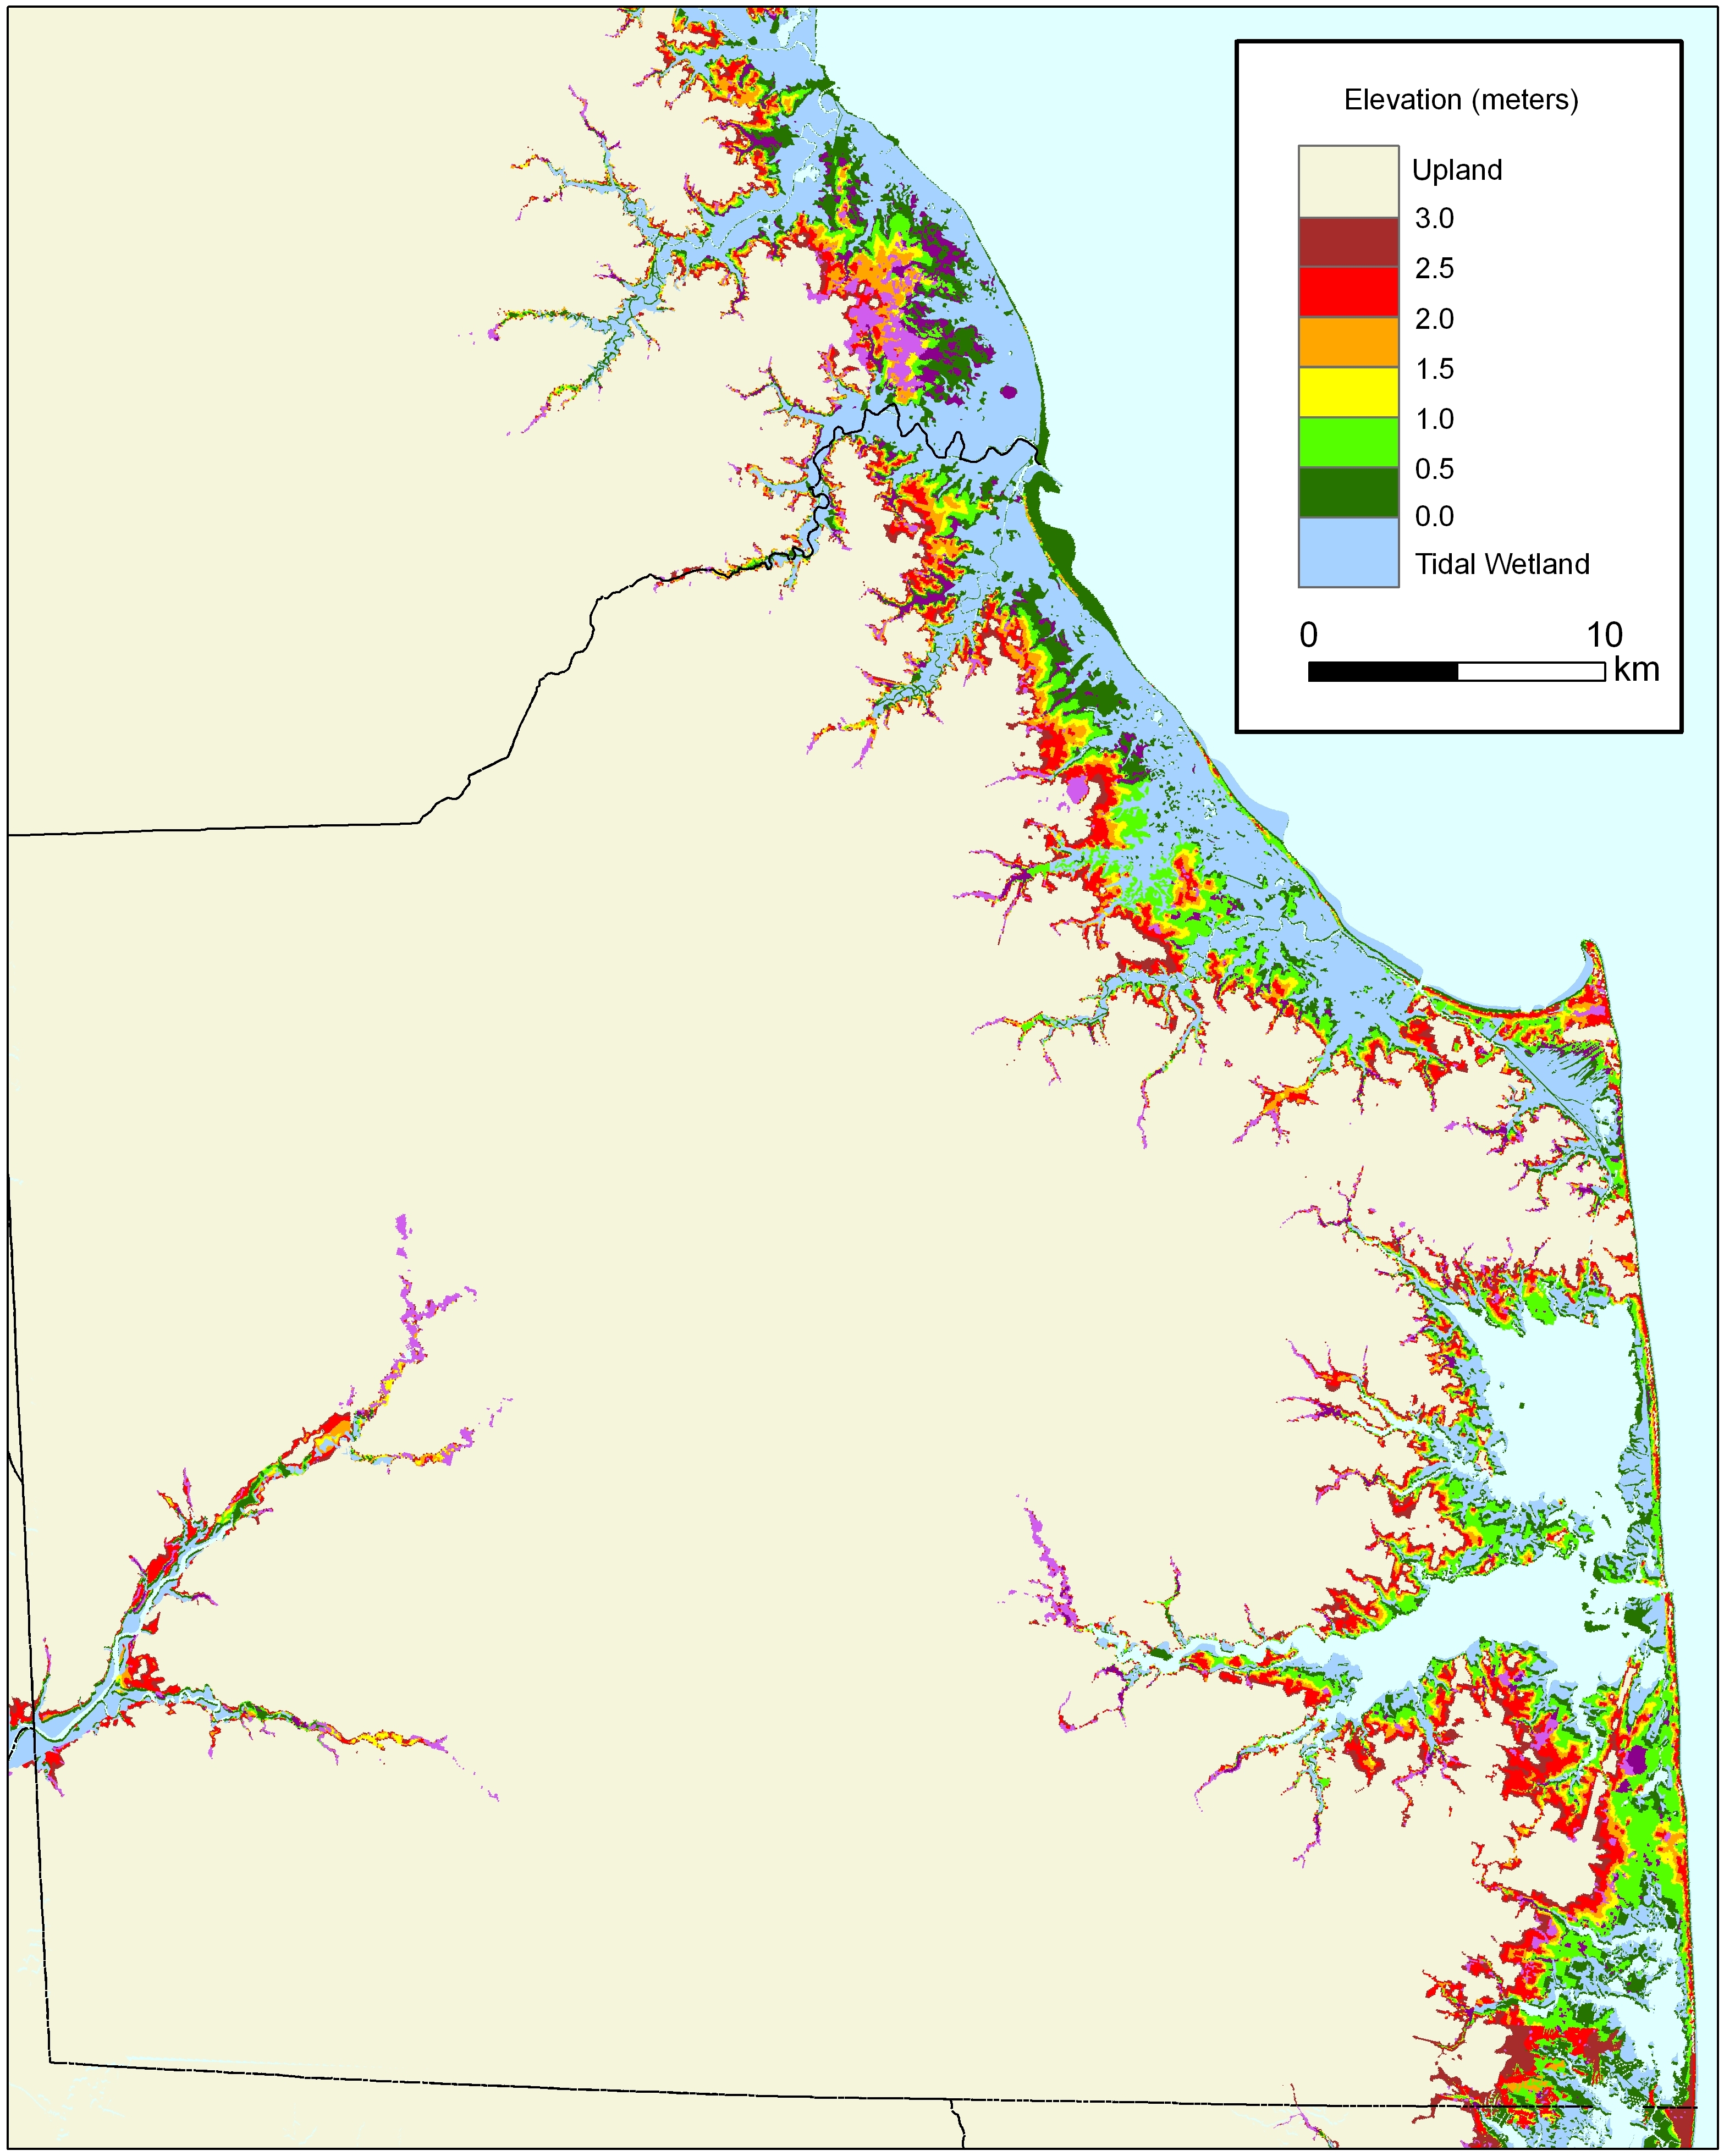
Sea Level Rise Maps for Delaware

!
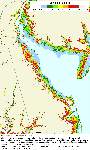
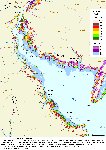
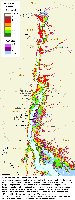
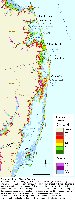
Most of these maps are drawn from an EPA study, which developed county-scale elevation maps to illustrate vulnerability to sea level rise, using existing data. The maps show elevations relative to spring high water, the average tide during new and full moons. The maps are not as accurate as has recently become possible using LIDAR. We also have some comments which may help you figure out how accurate our maps are for a particular location.

Delaware


Delaware
1-meter contour interval

Delaware Bay:  Vulnerability to sea level rise 


Delaware Bay

Delaware River:  Vulnerability to sea level rise 


Delaware River

Cape Henlopen to Chincoteague: vulnerability to sea level rise 
Delaware and 
Maryland
Atlantic Coast

Delaware 50-cm contour interval


Delaware
50-cm contour interval
 

Delaware 50-cm contour interval 


New Castle County
50-cm contour interval
 

Kent County: 50-cm contour interval 


Kent County
50-cm contour interval
 

Sussex County 50-cm contour interval 


Sussex County
50-cm contour interval