!

Sea Level Rise Maps for Virginia

!


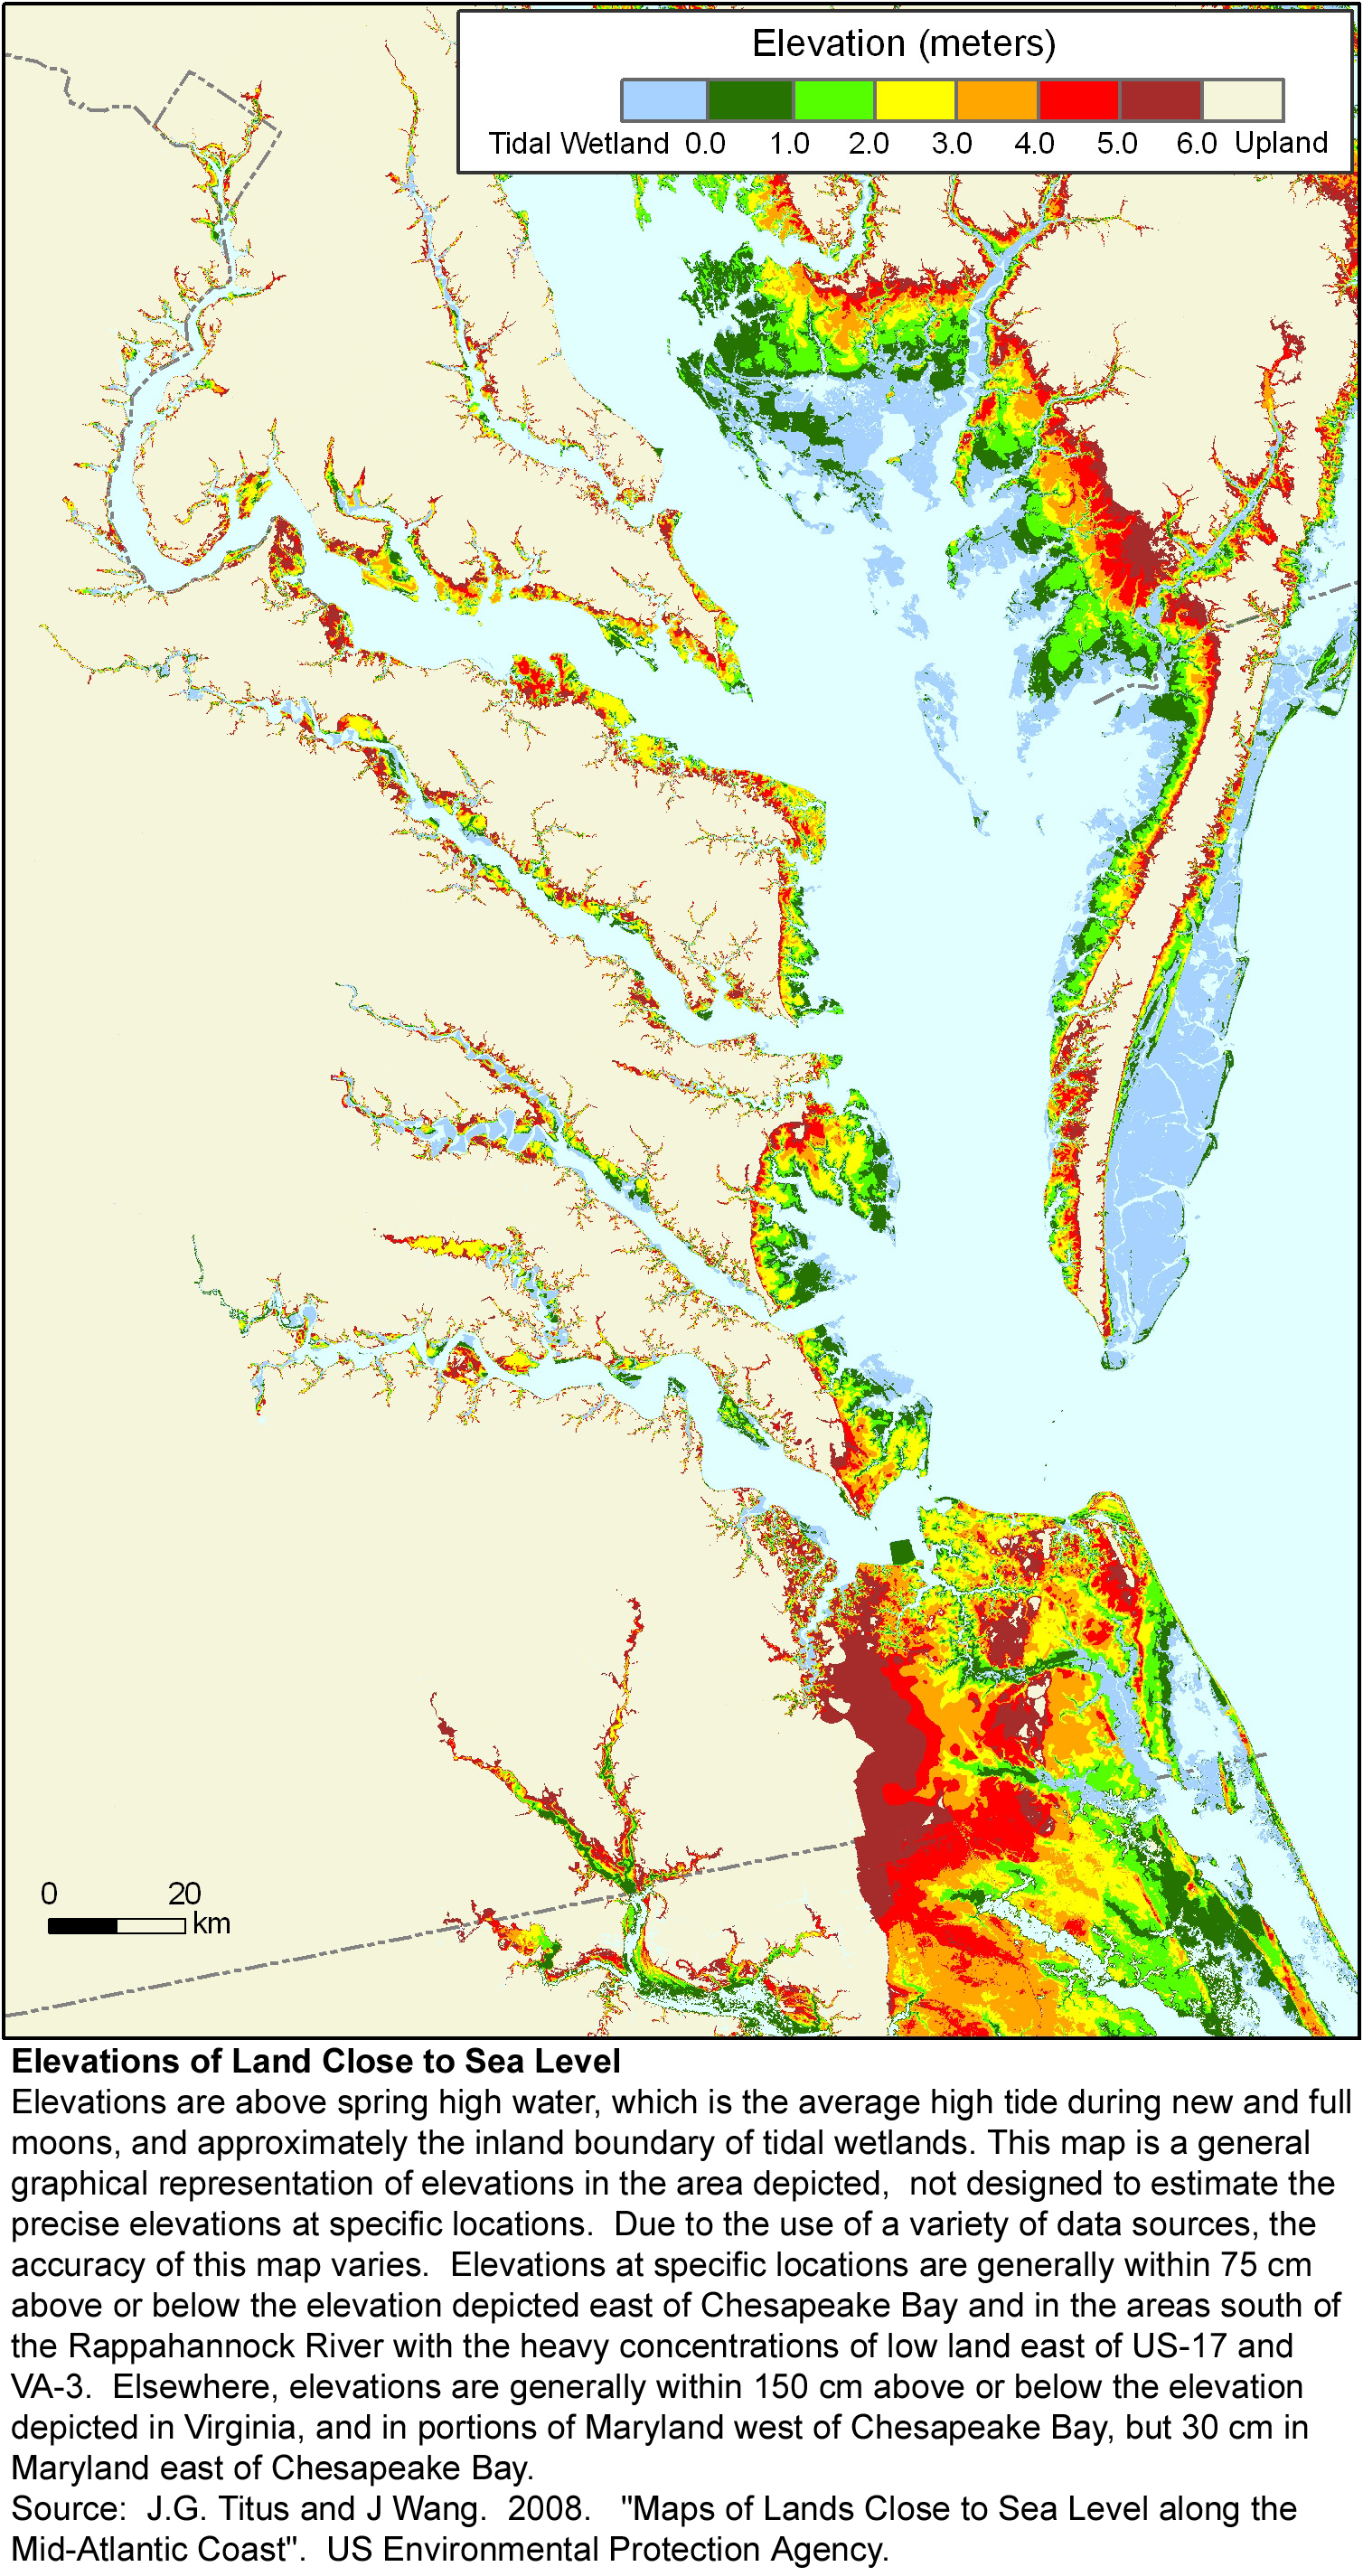
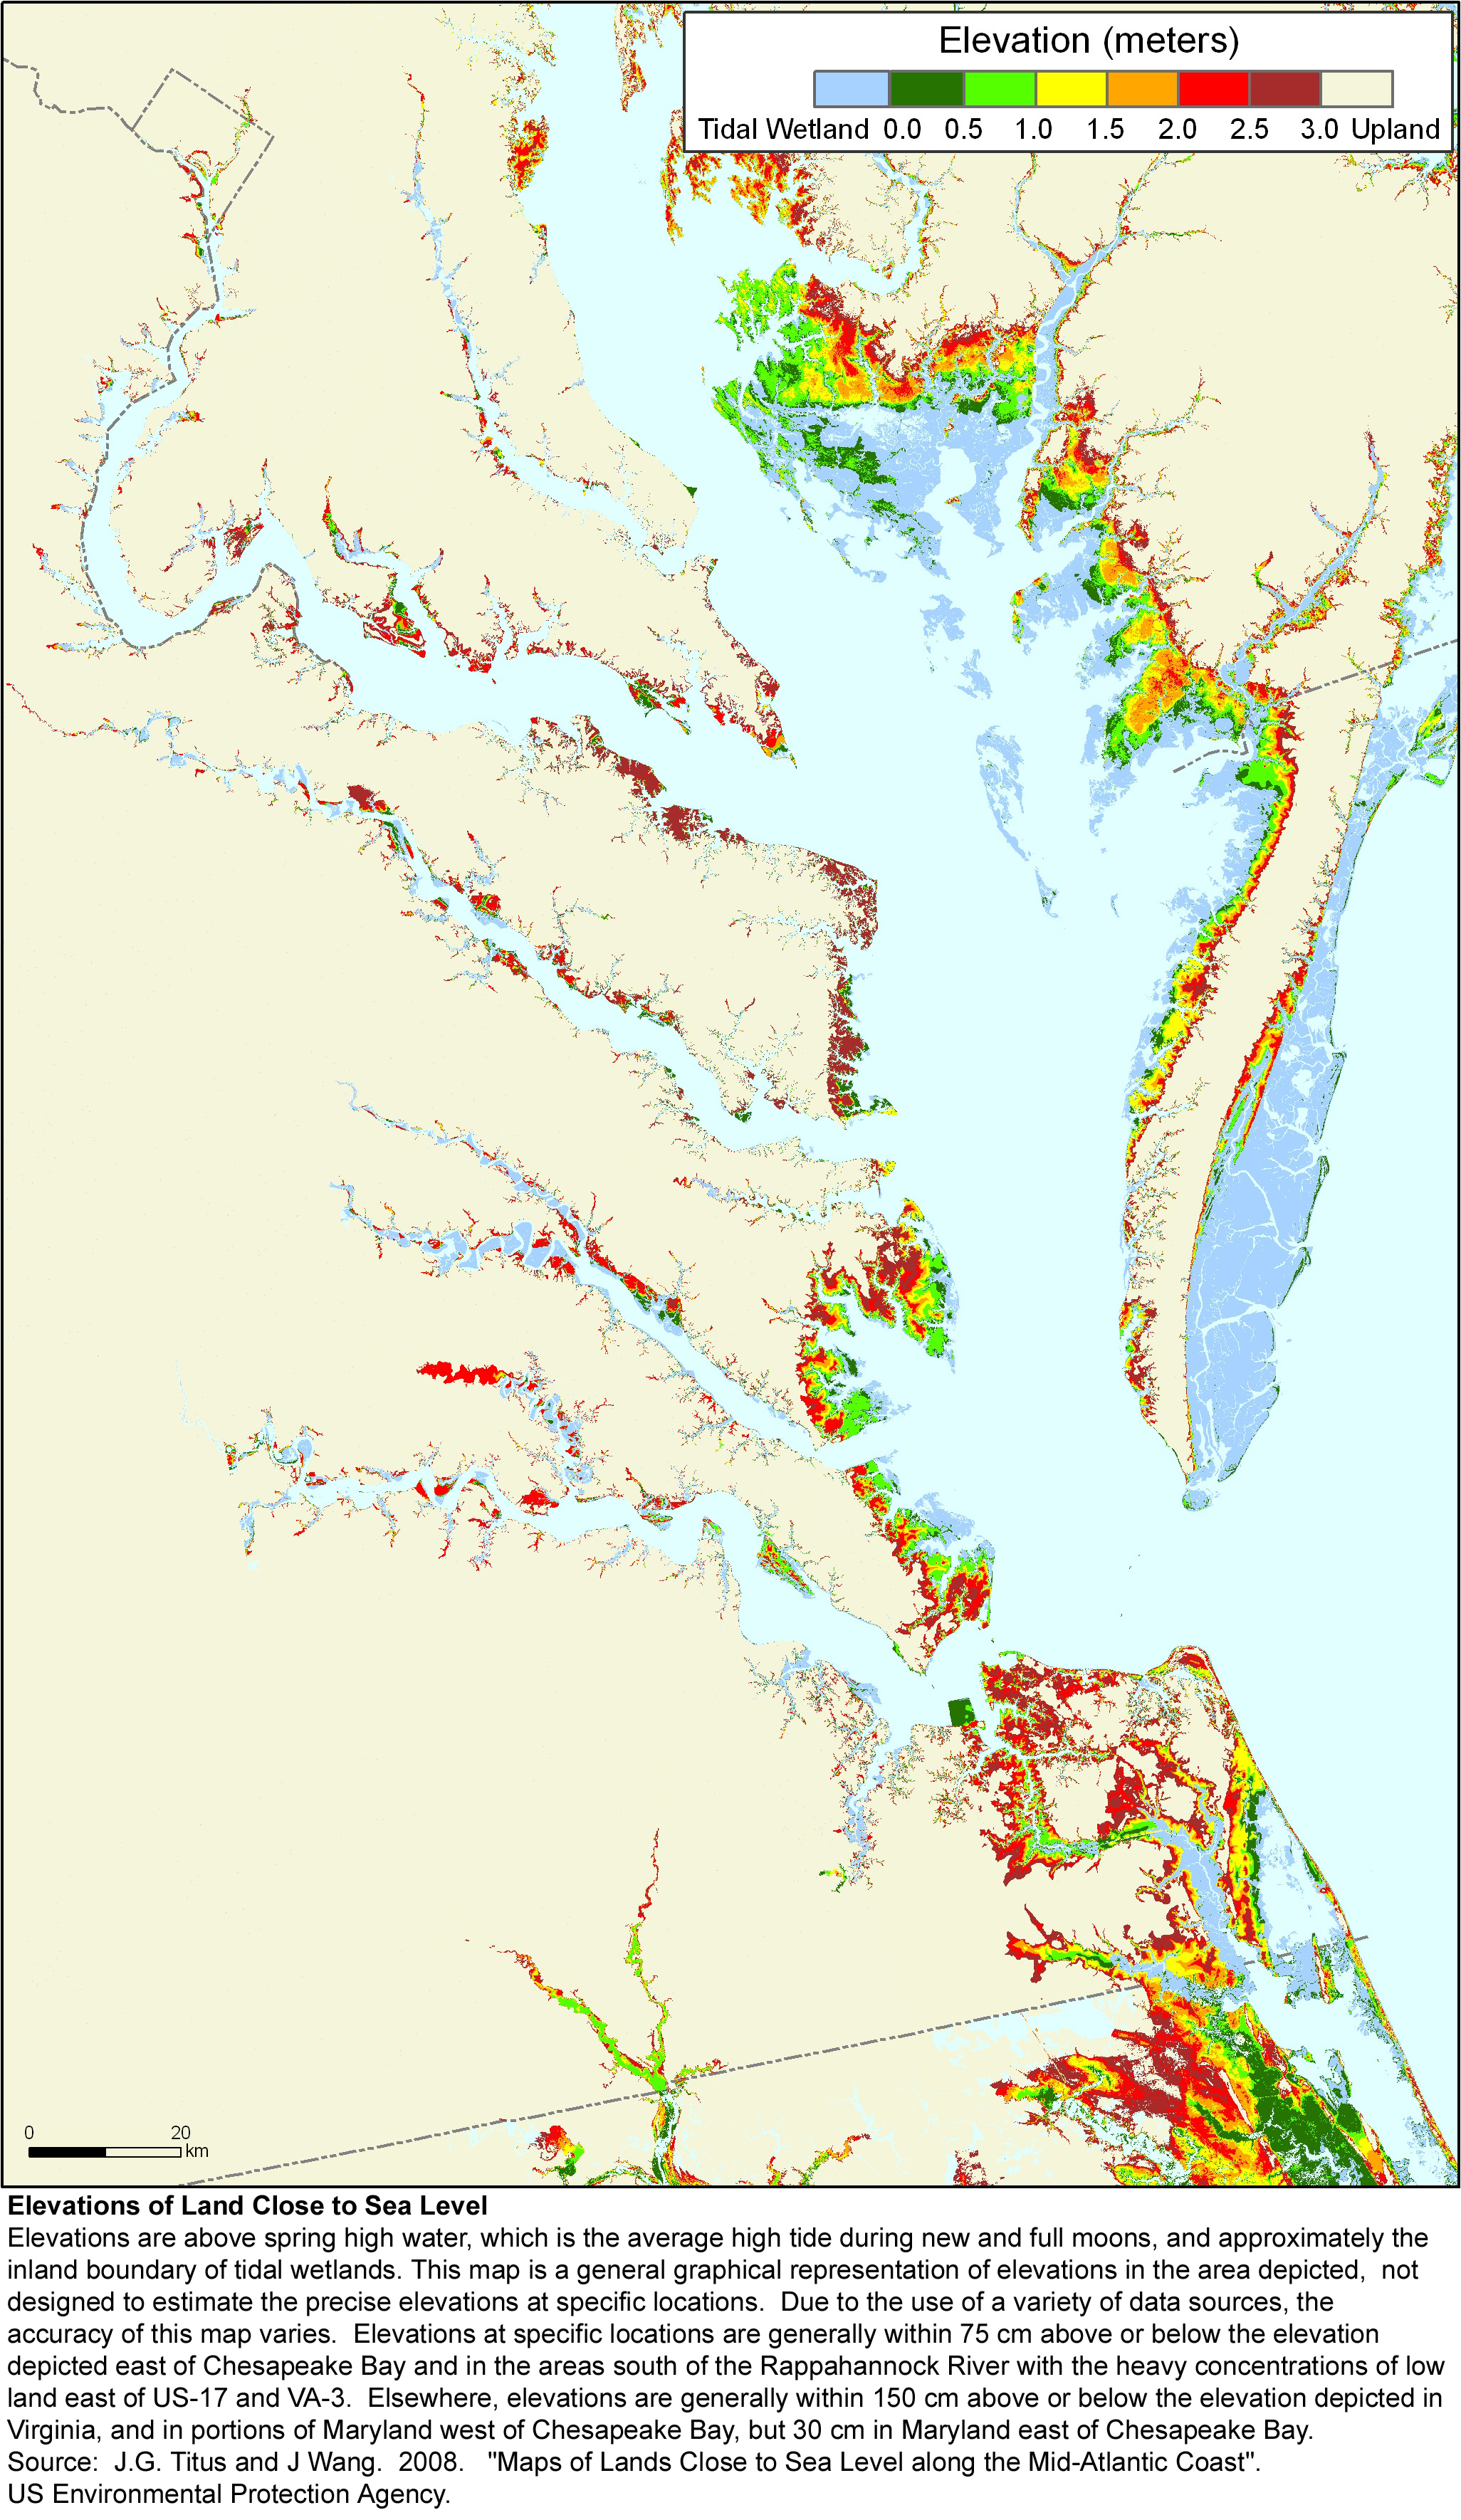
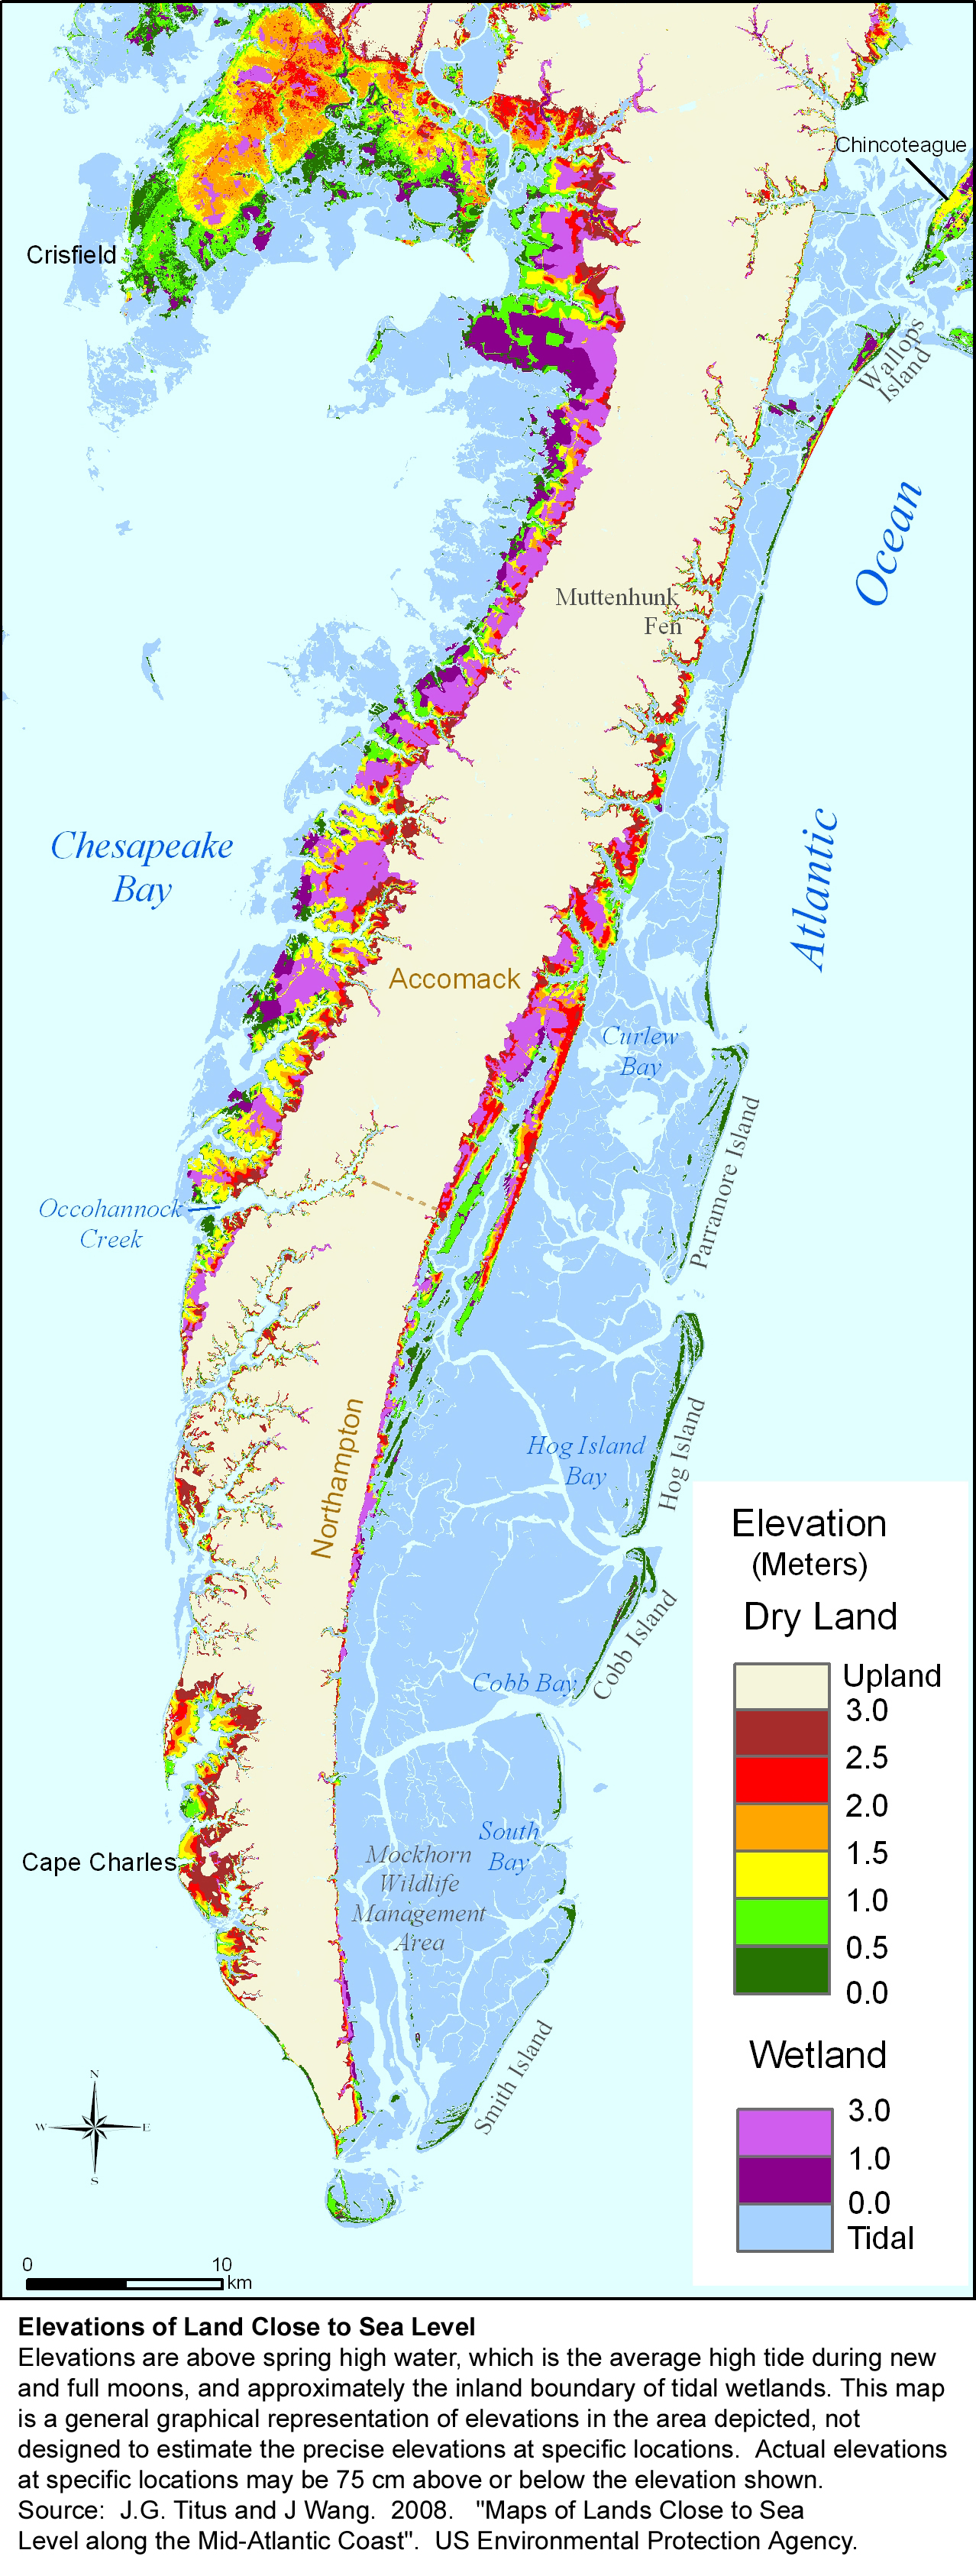
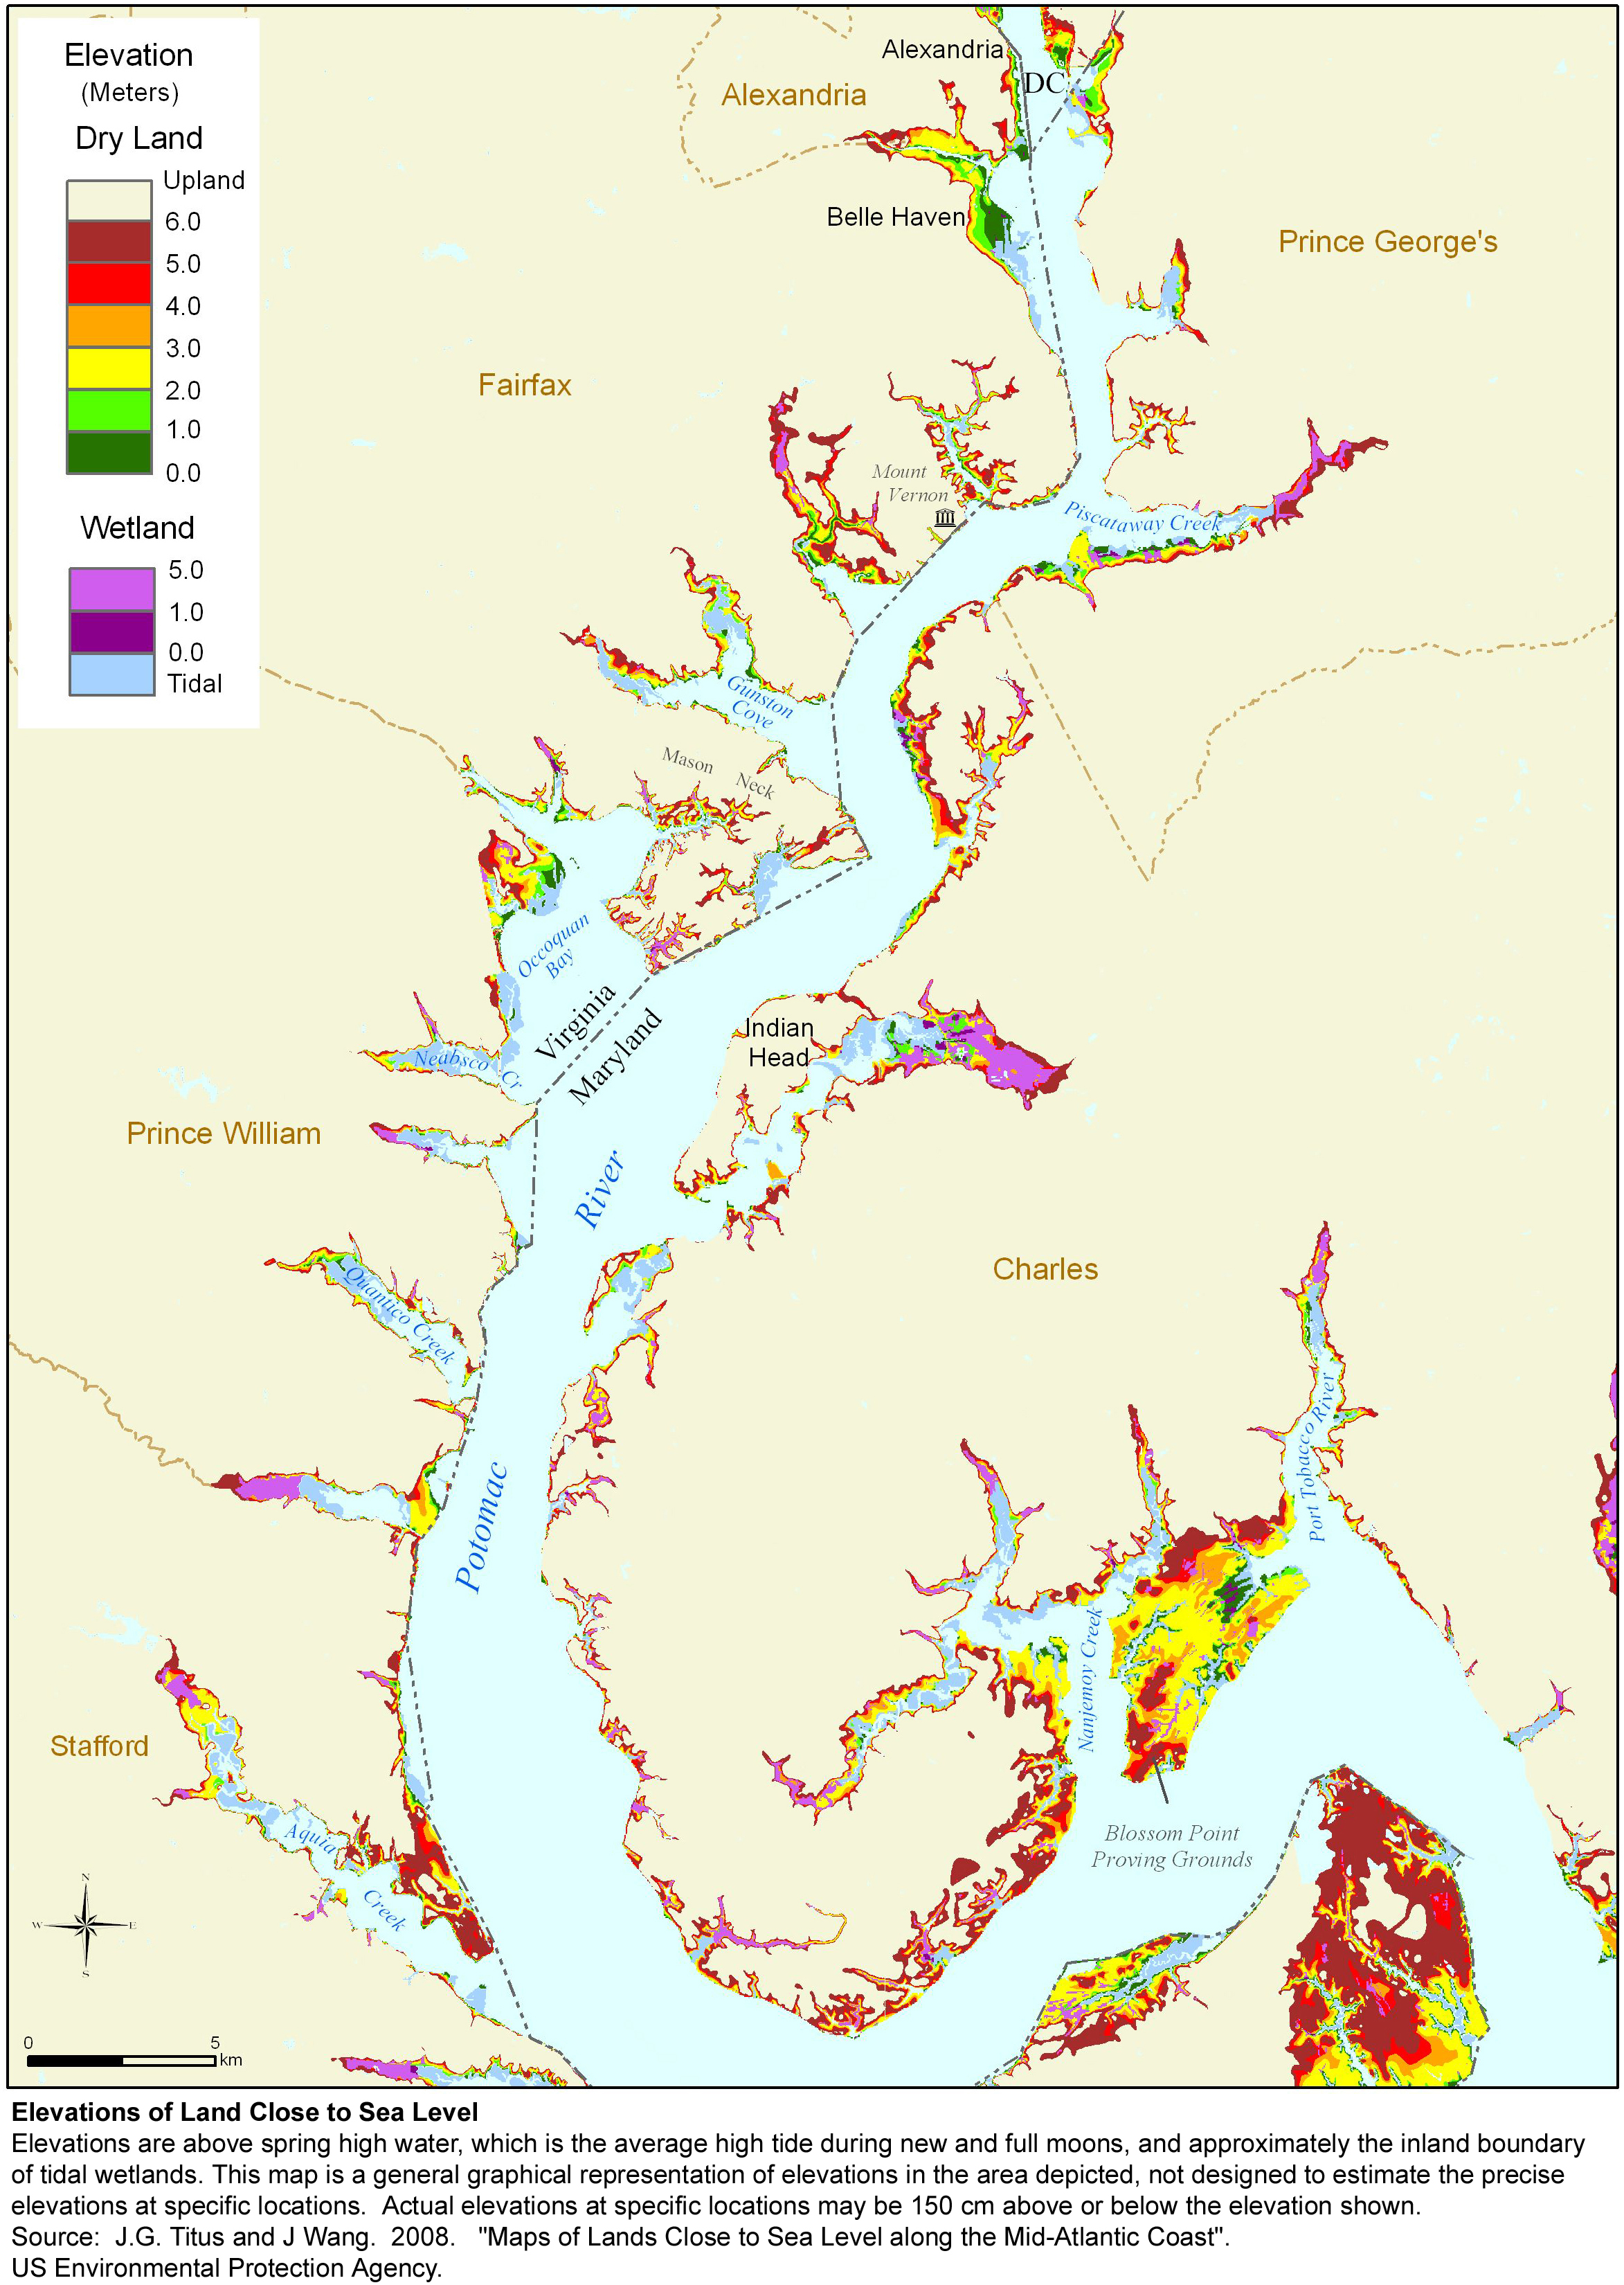
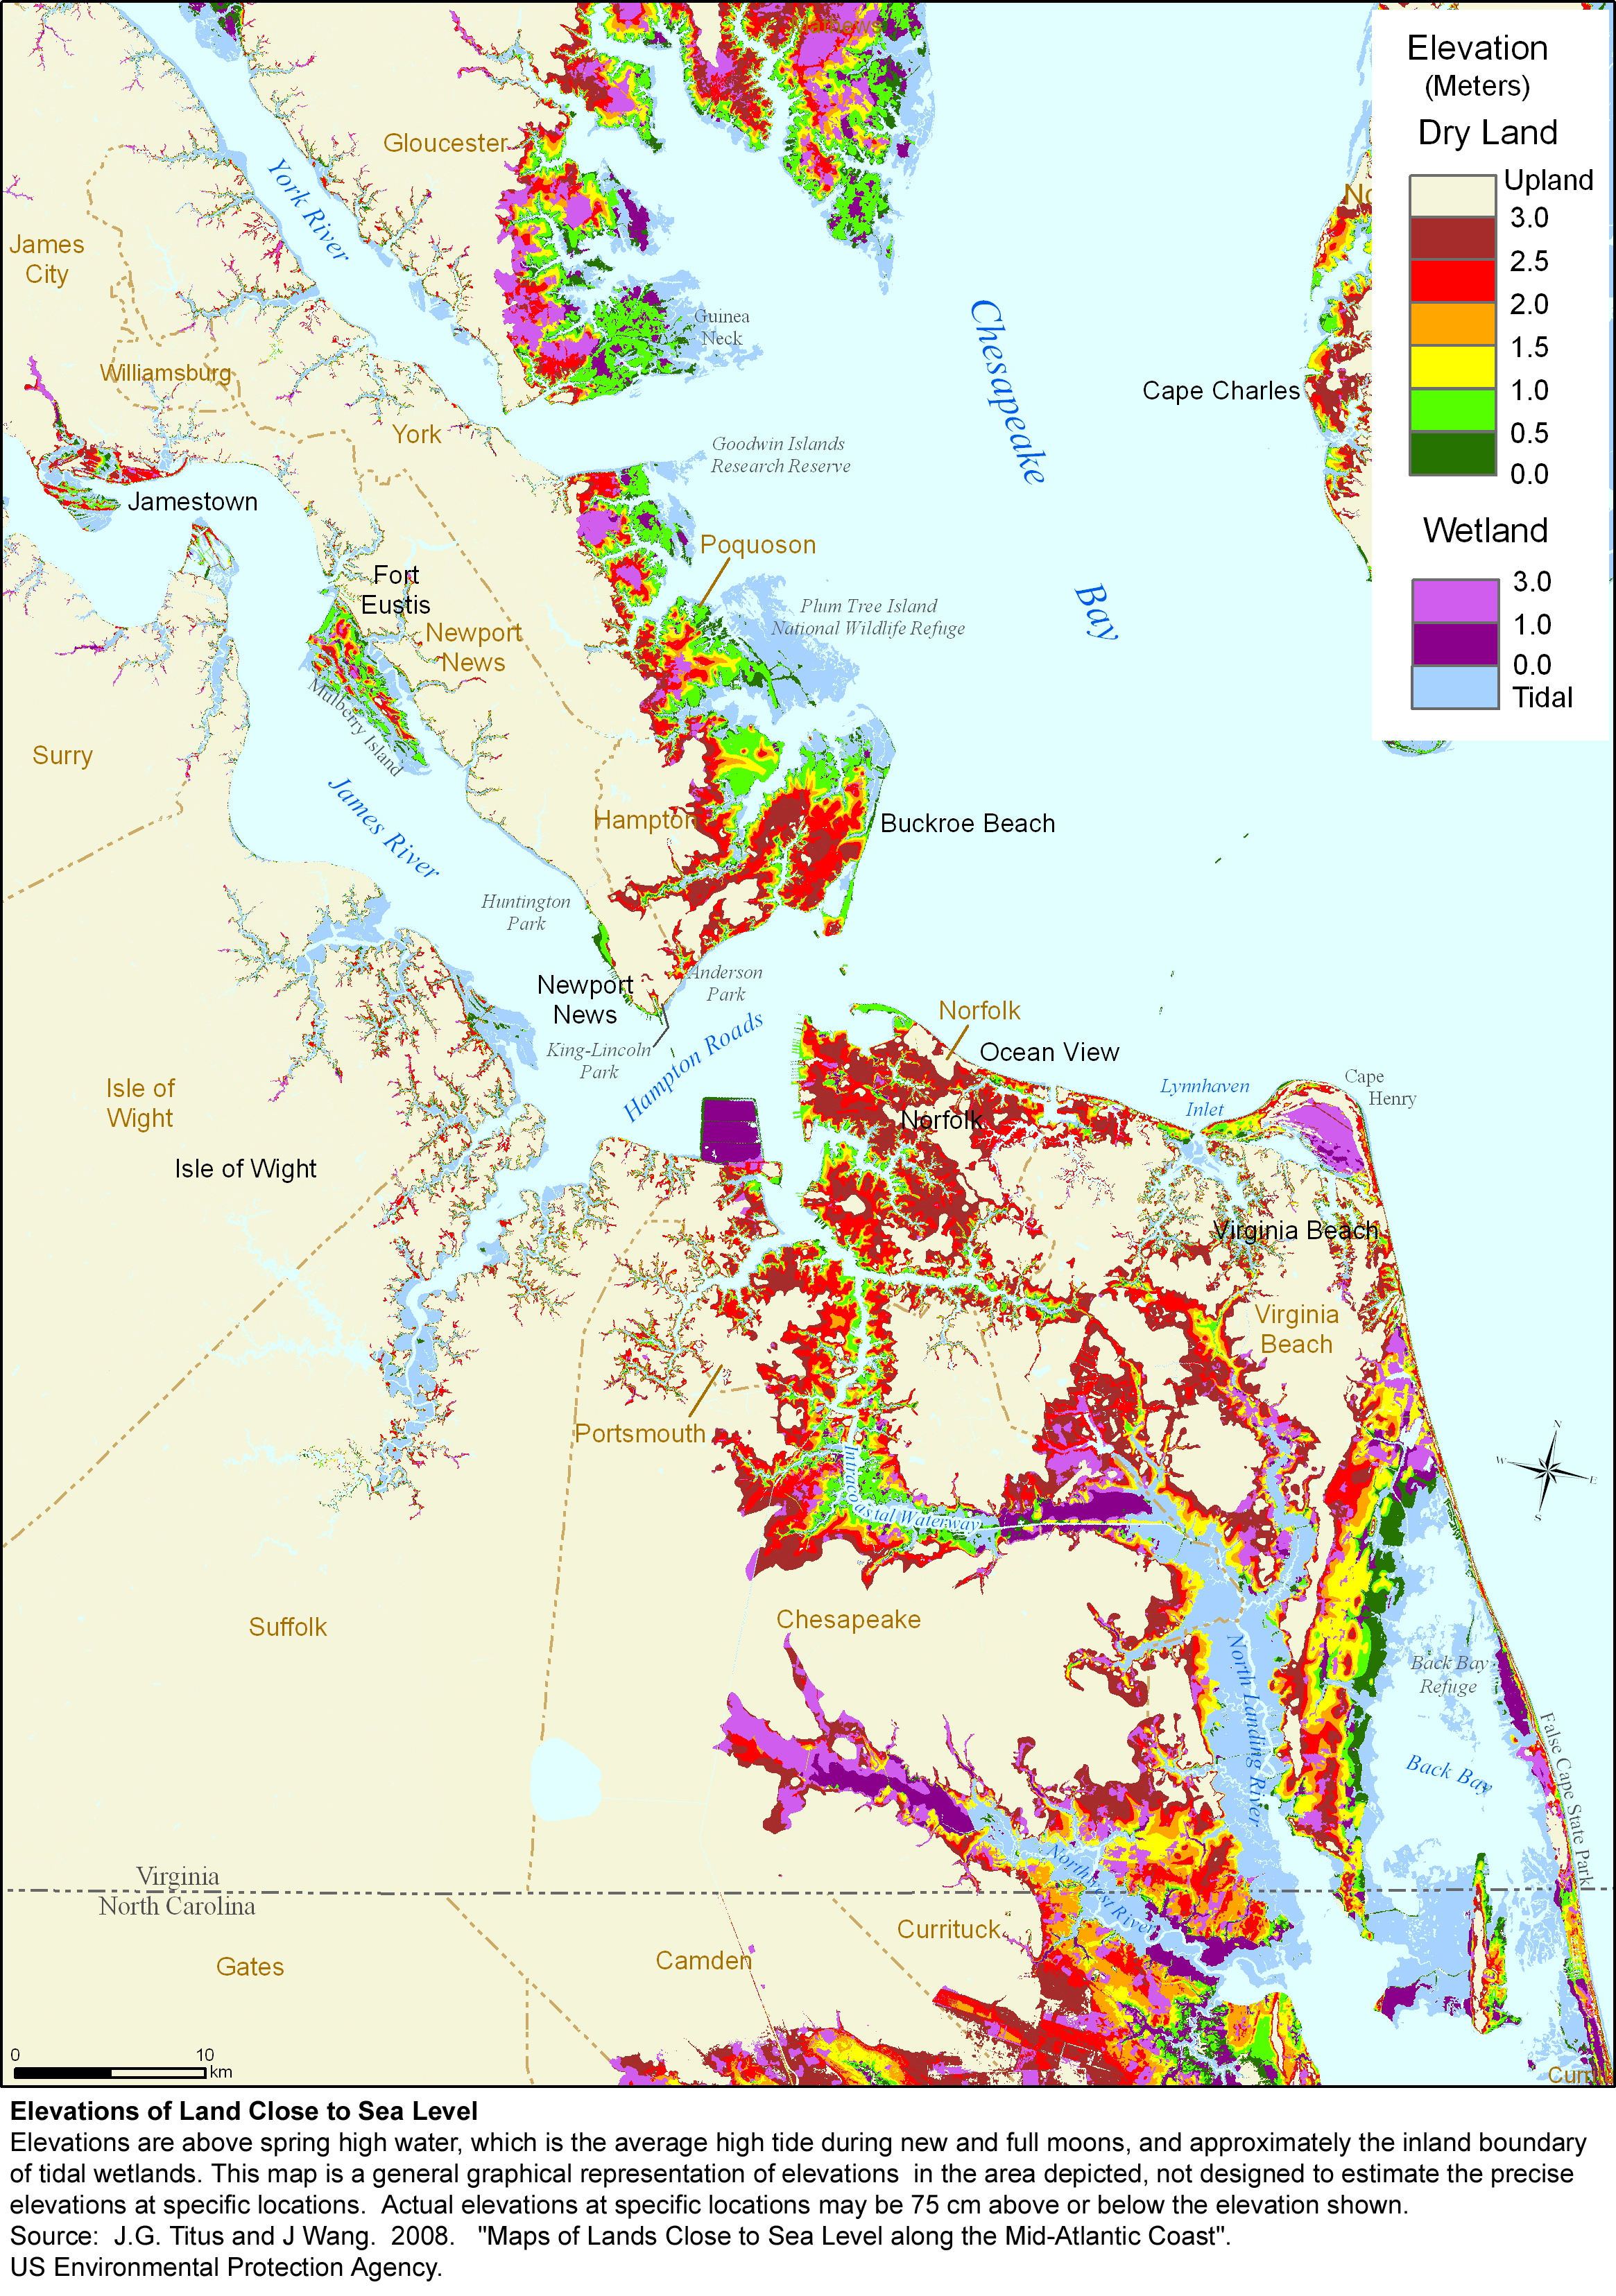
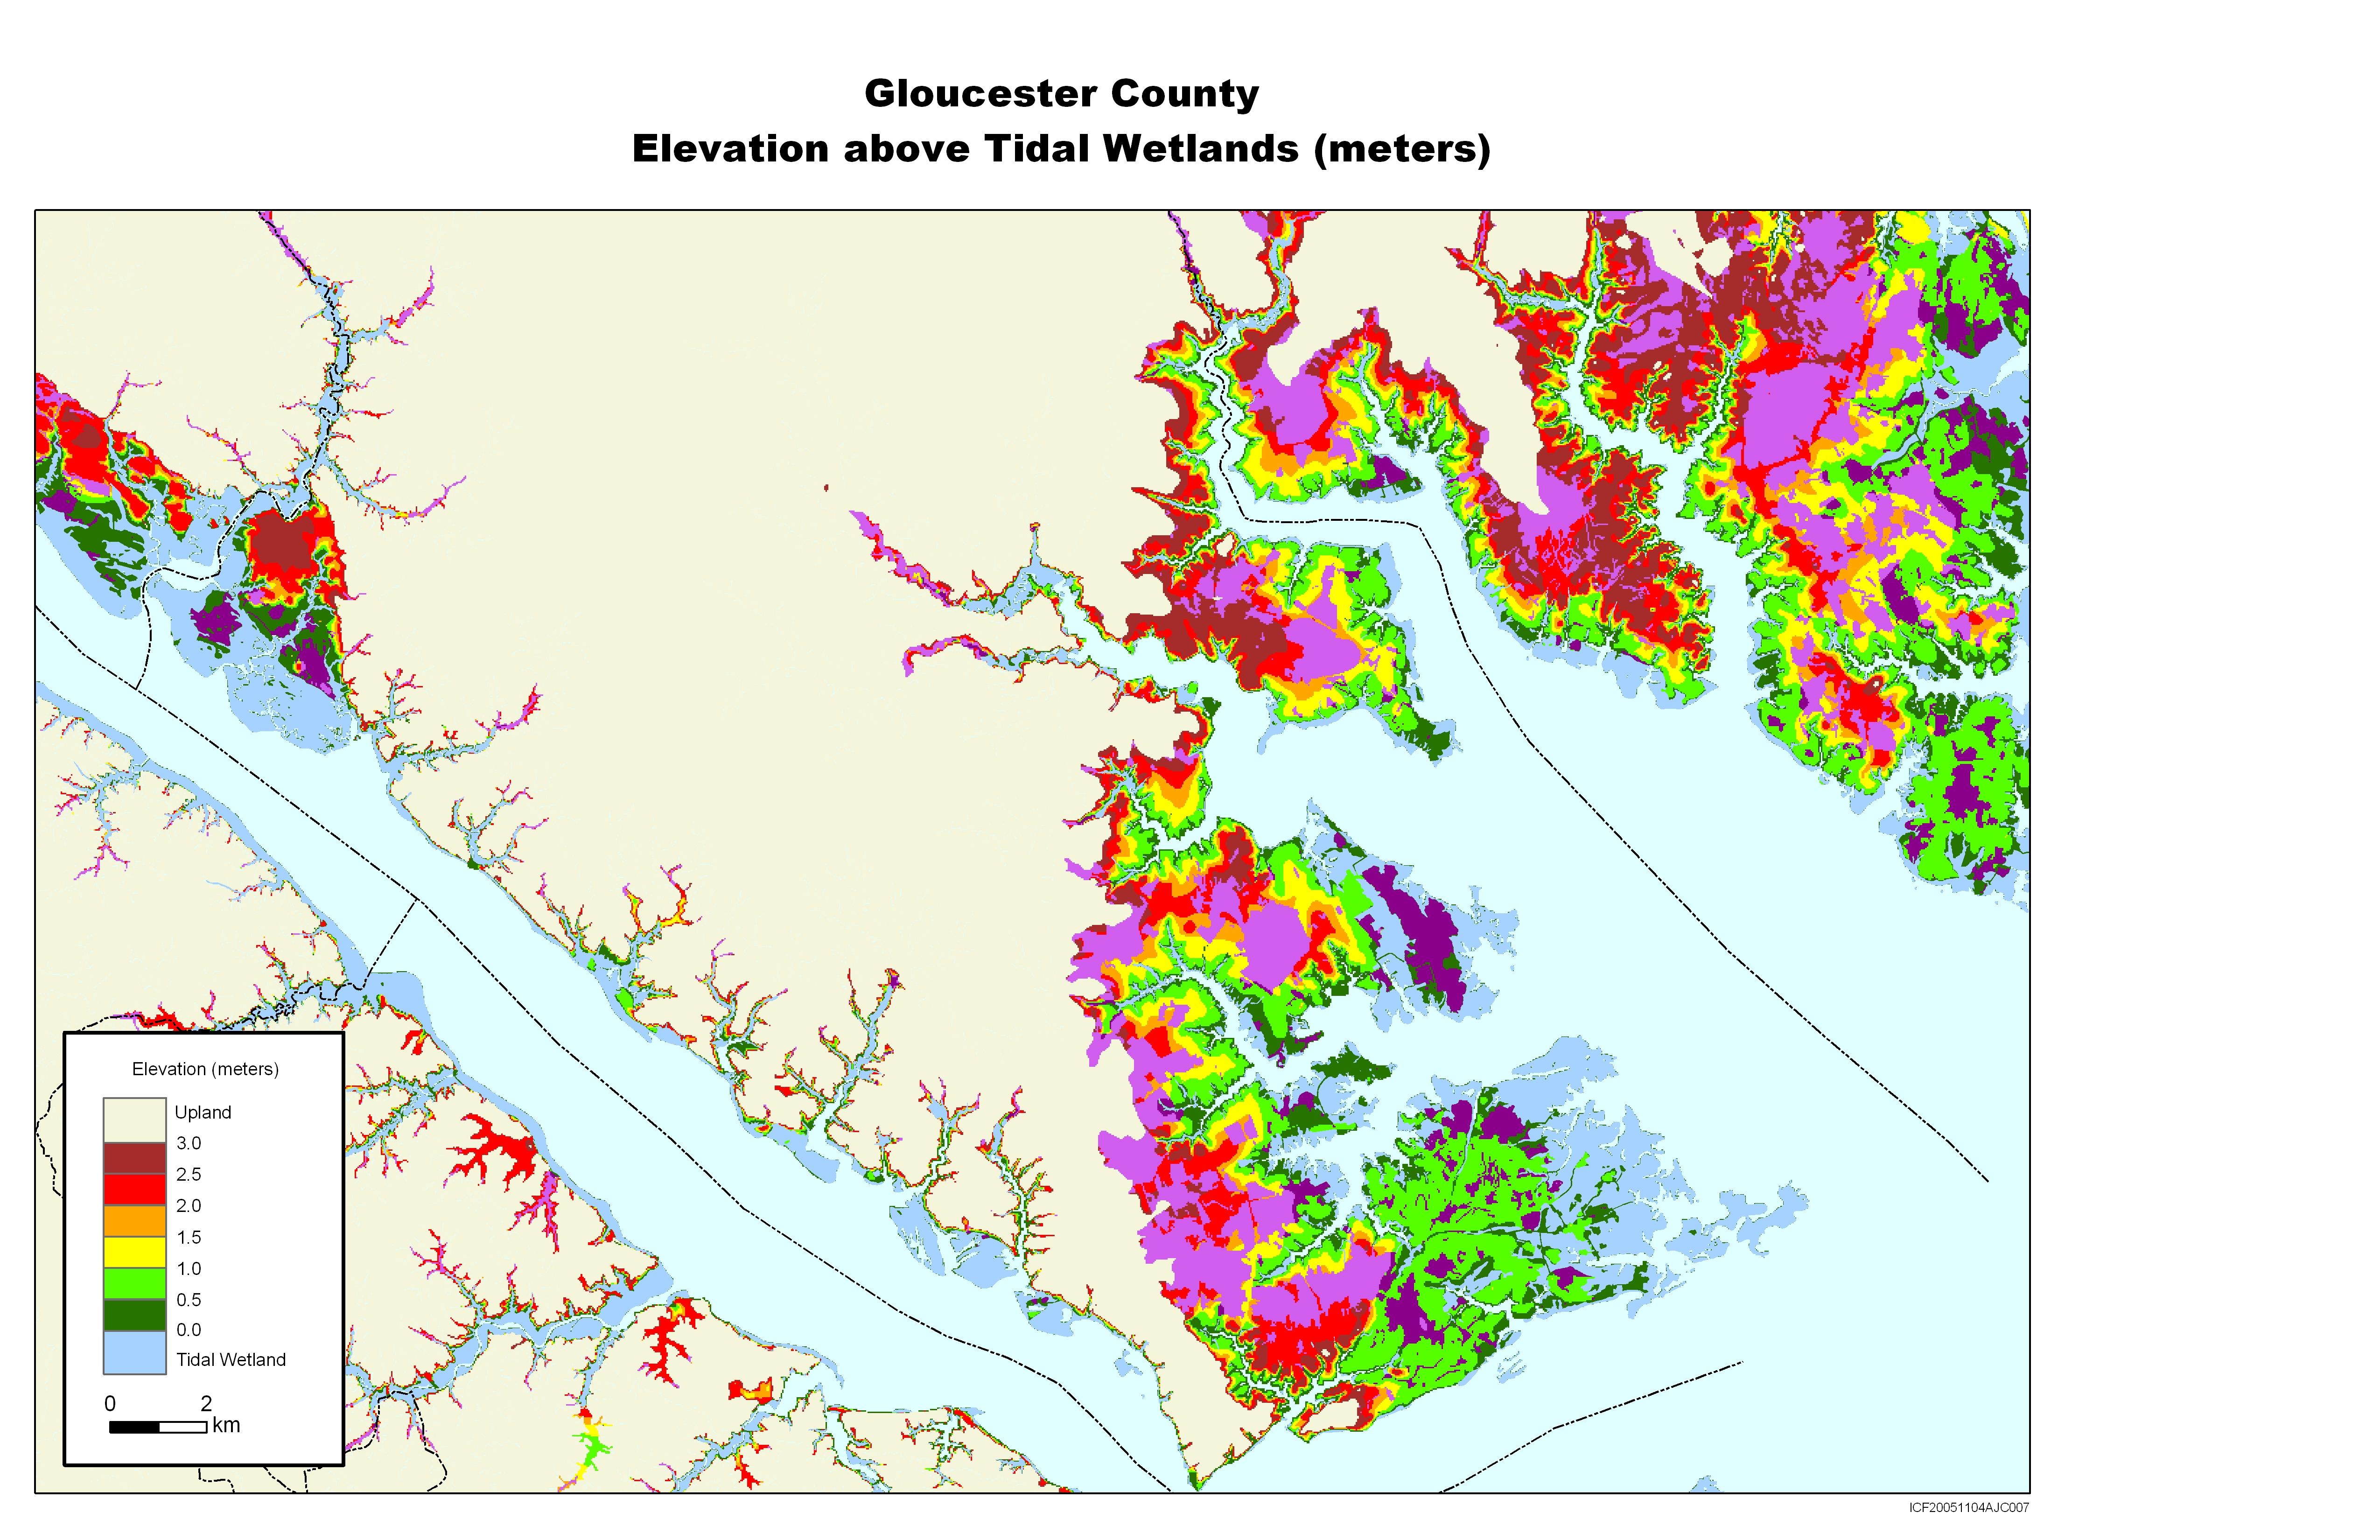
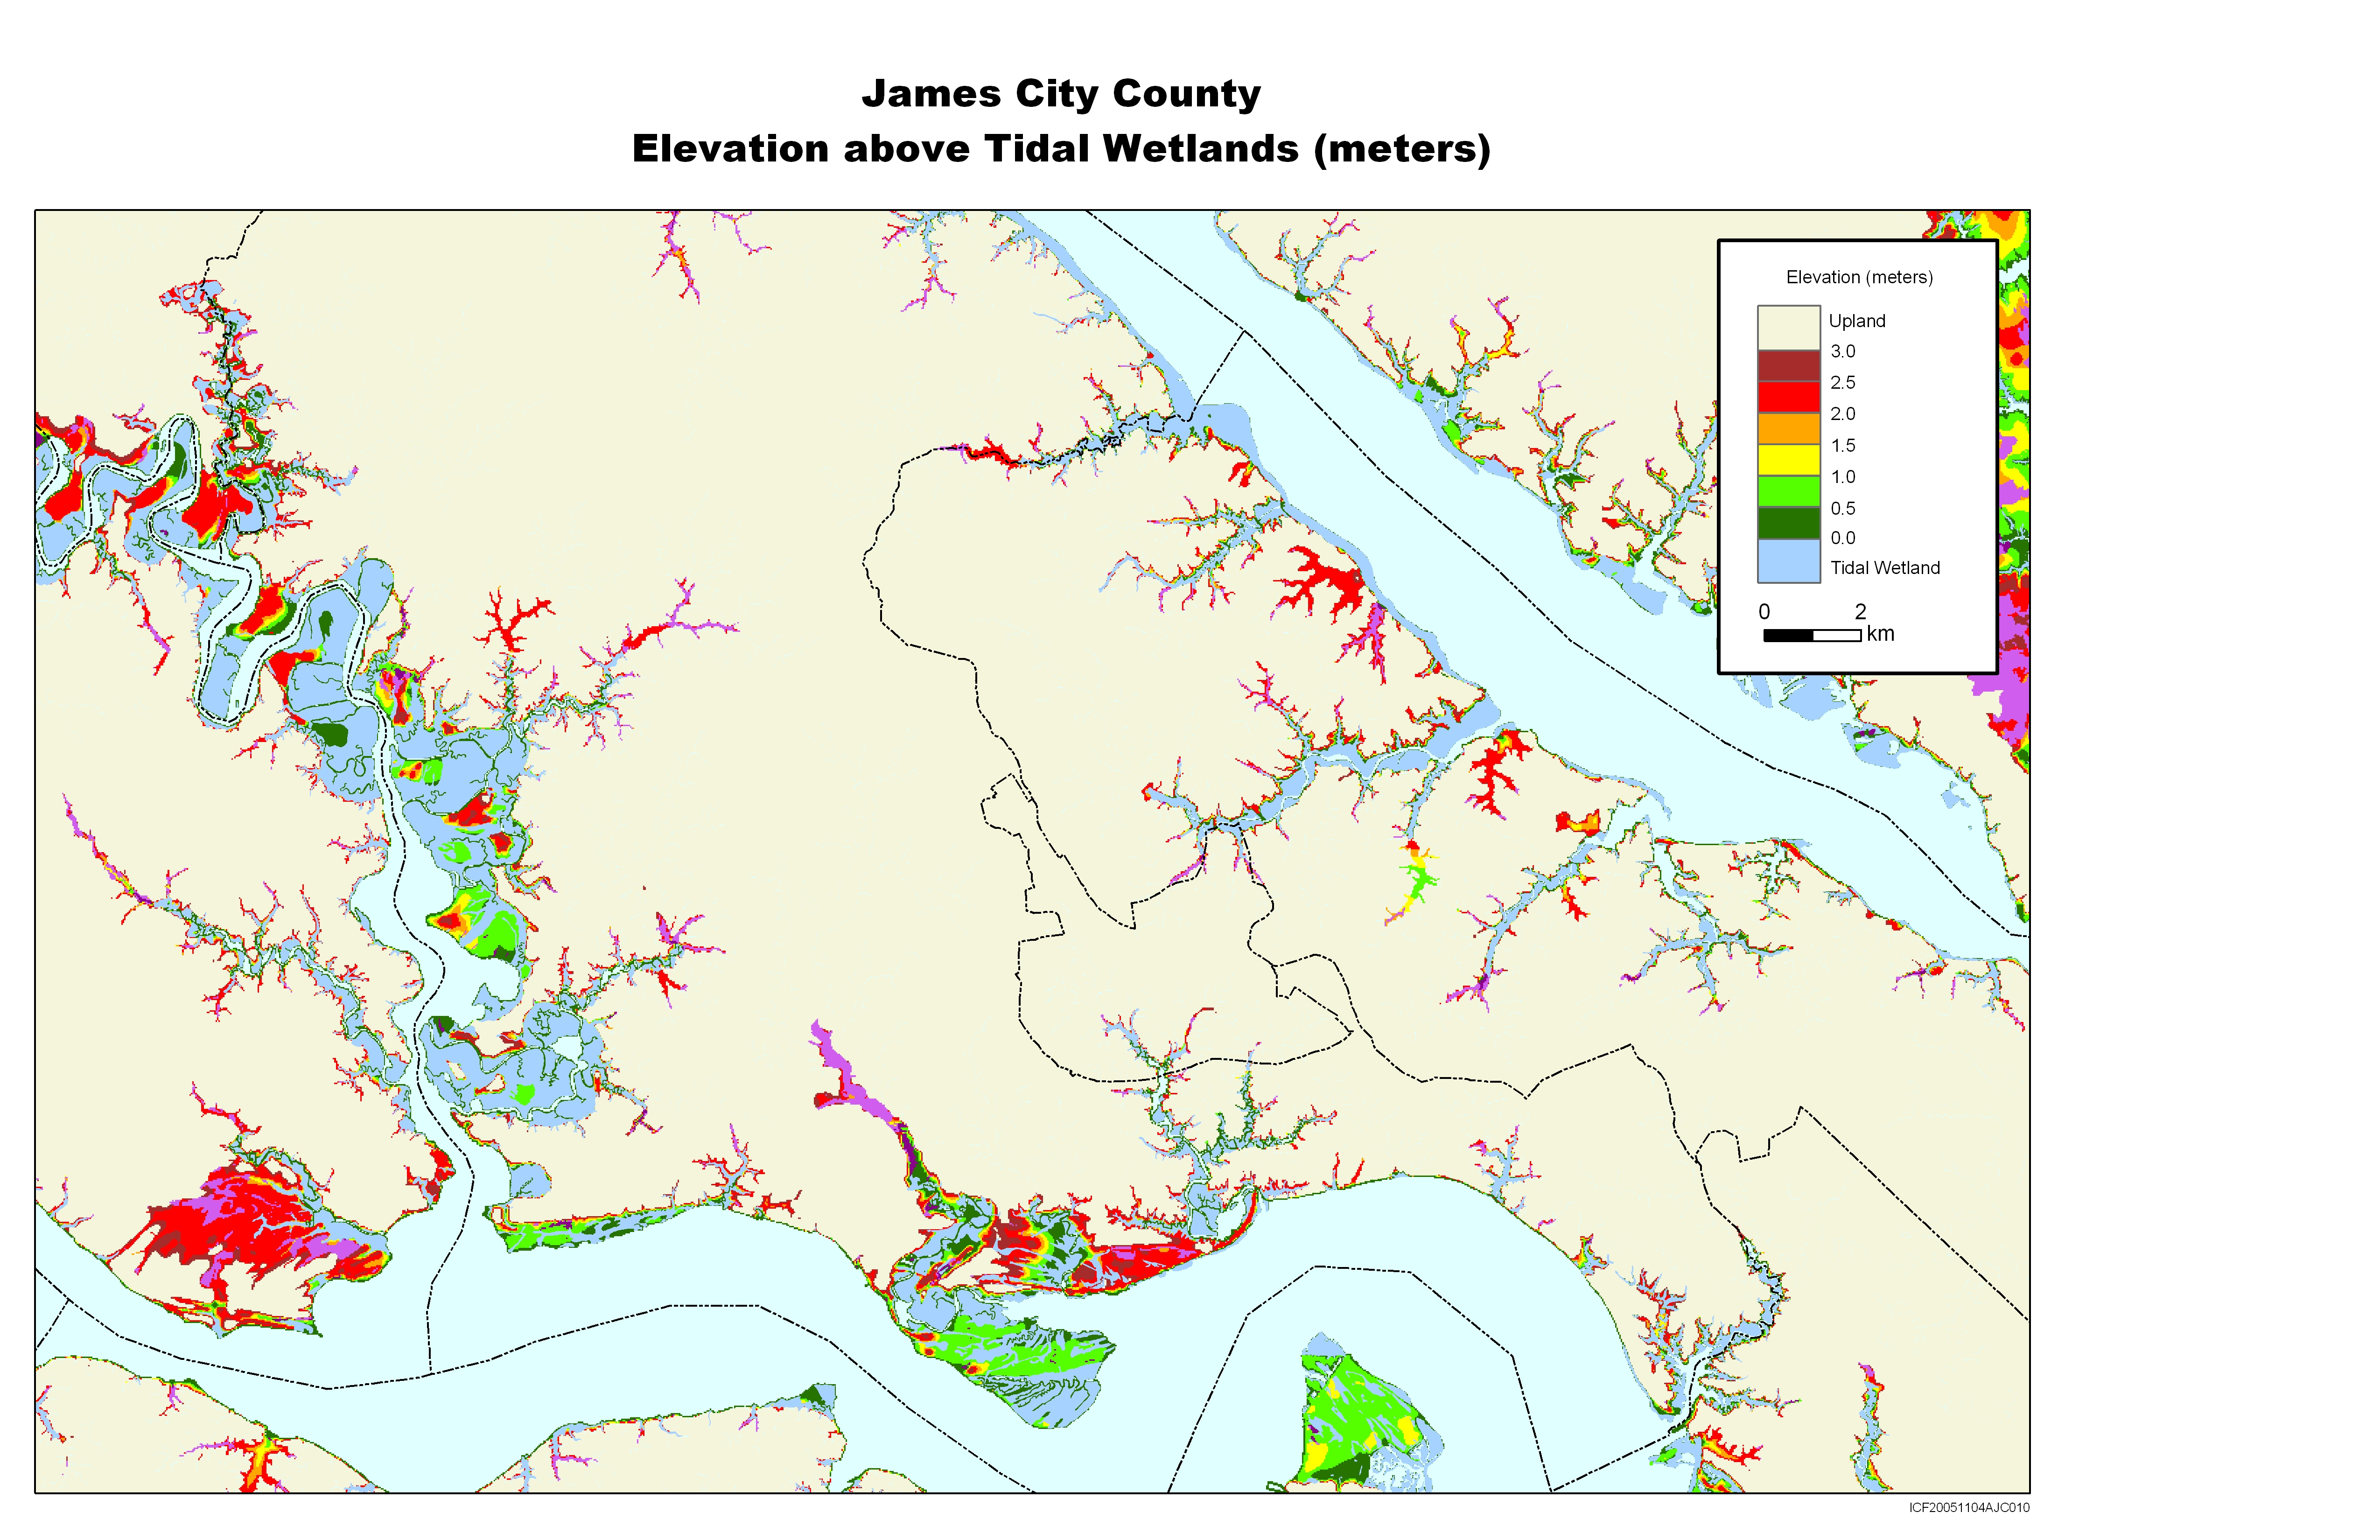
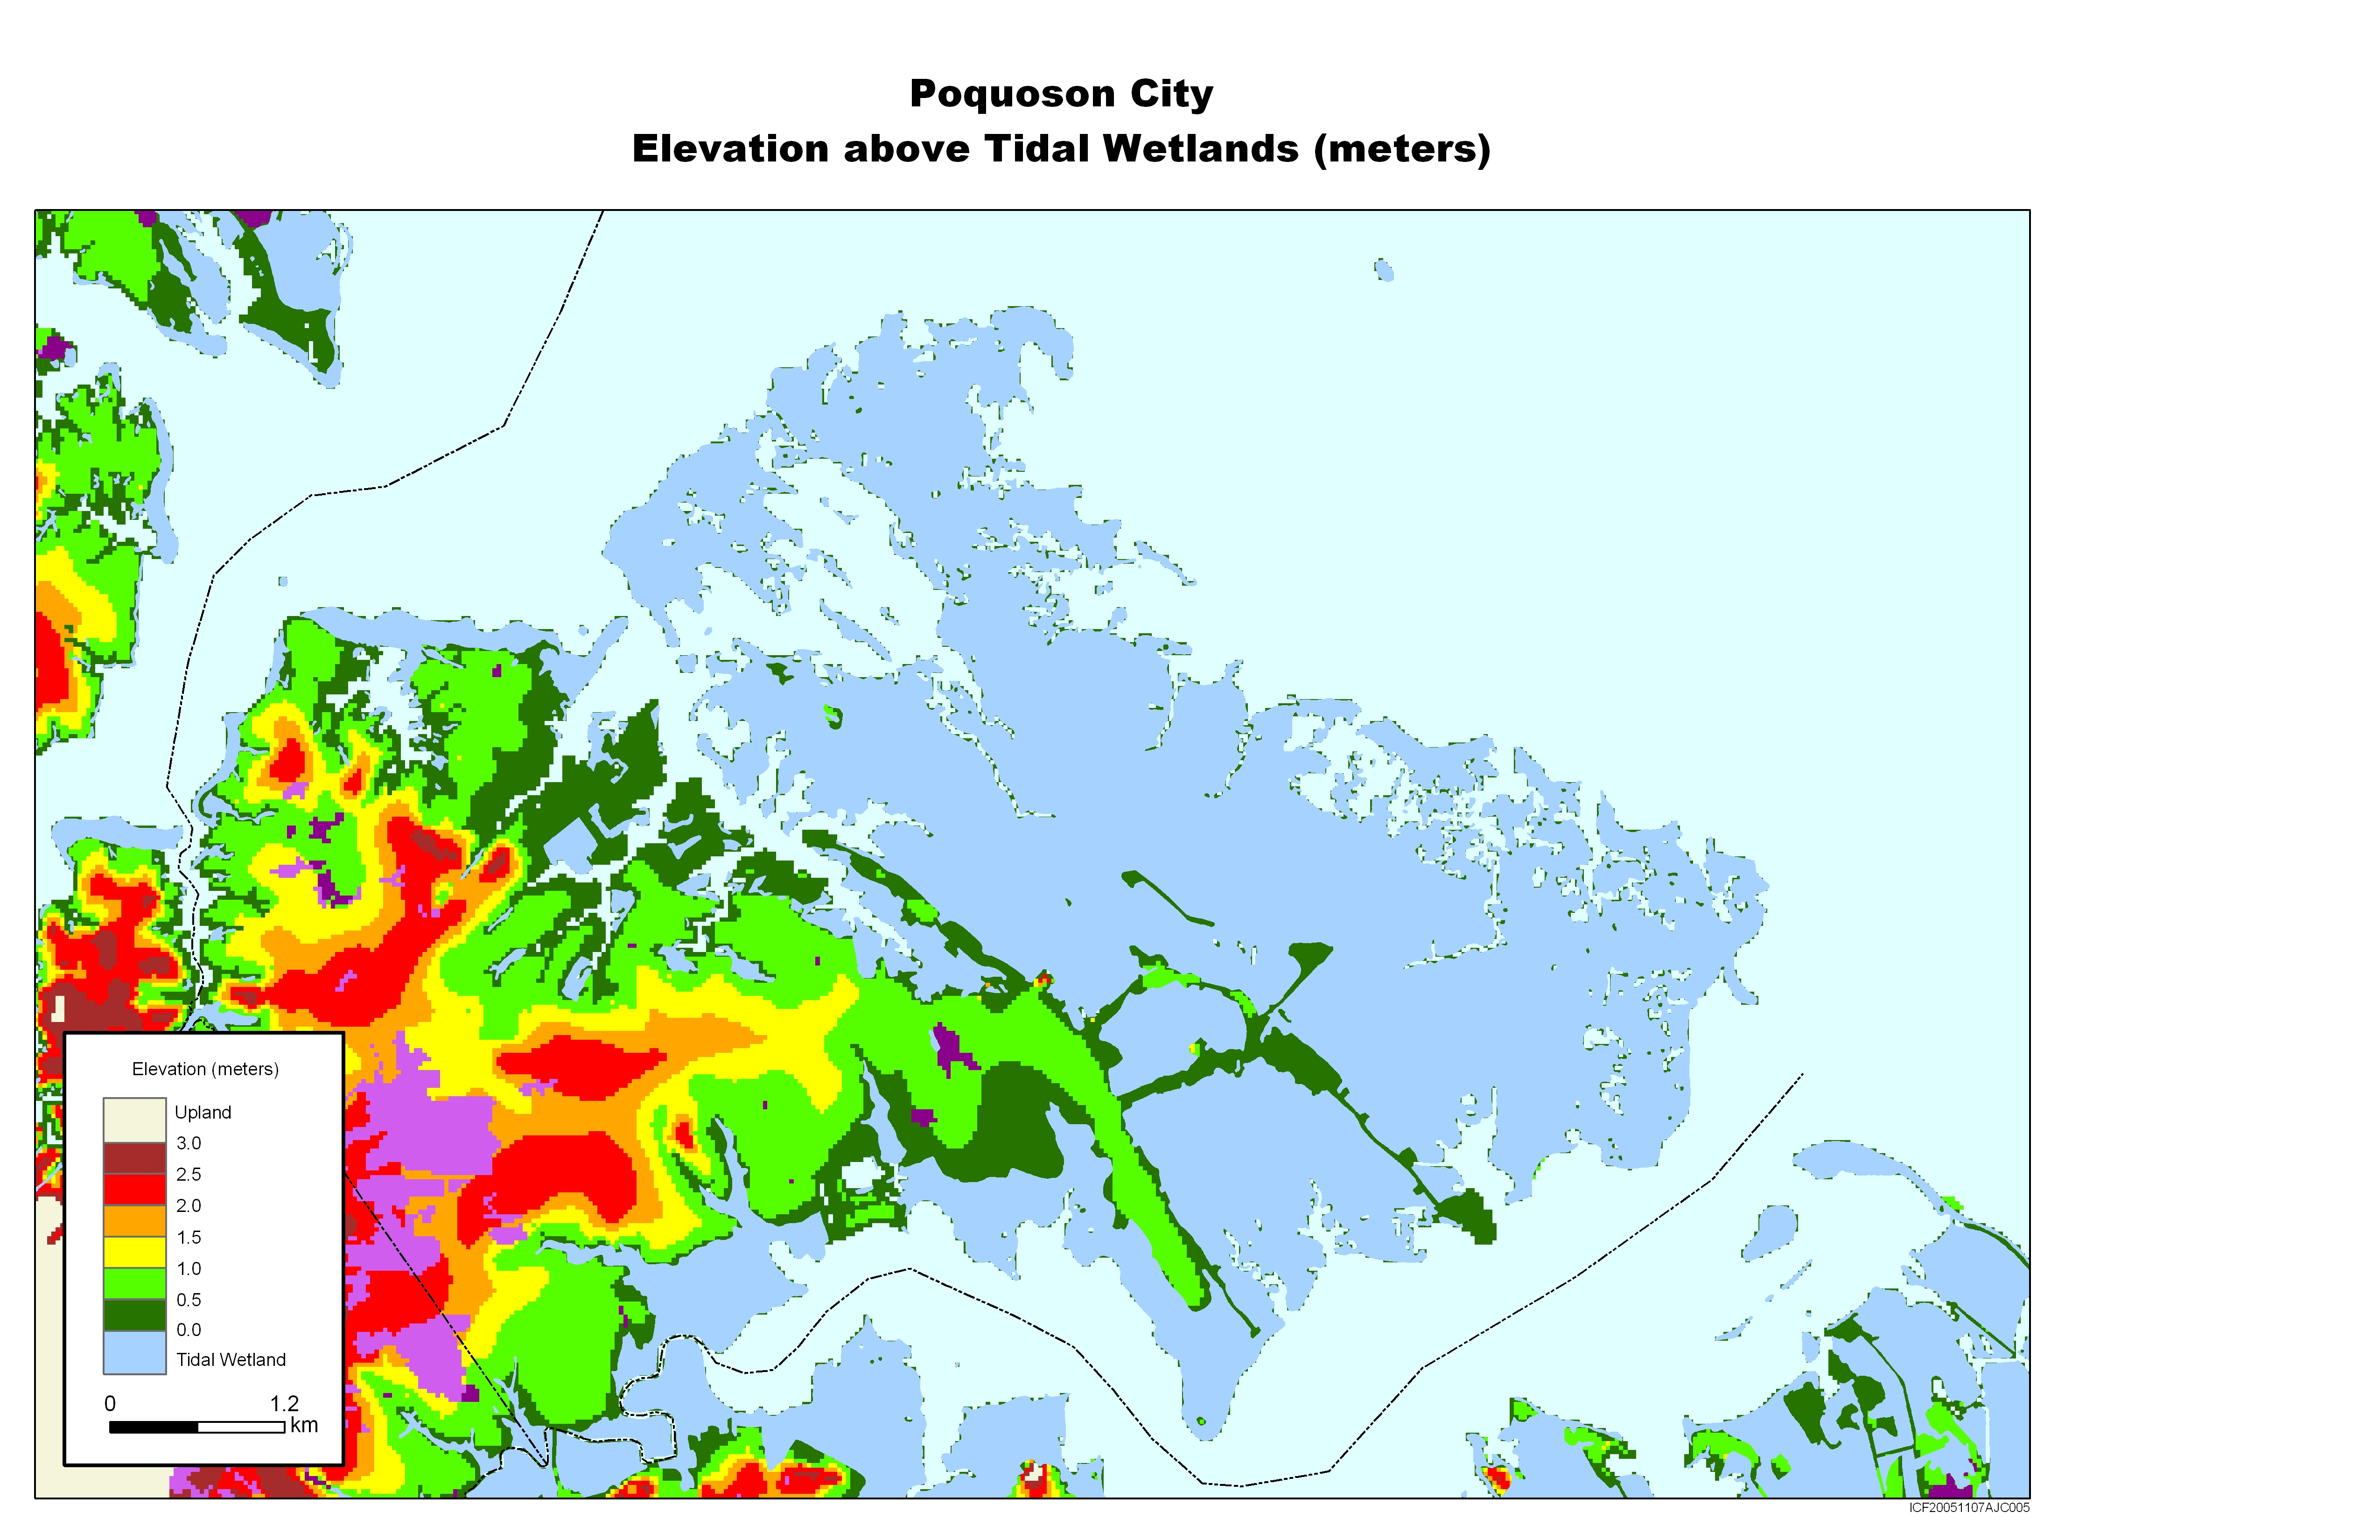
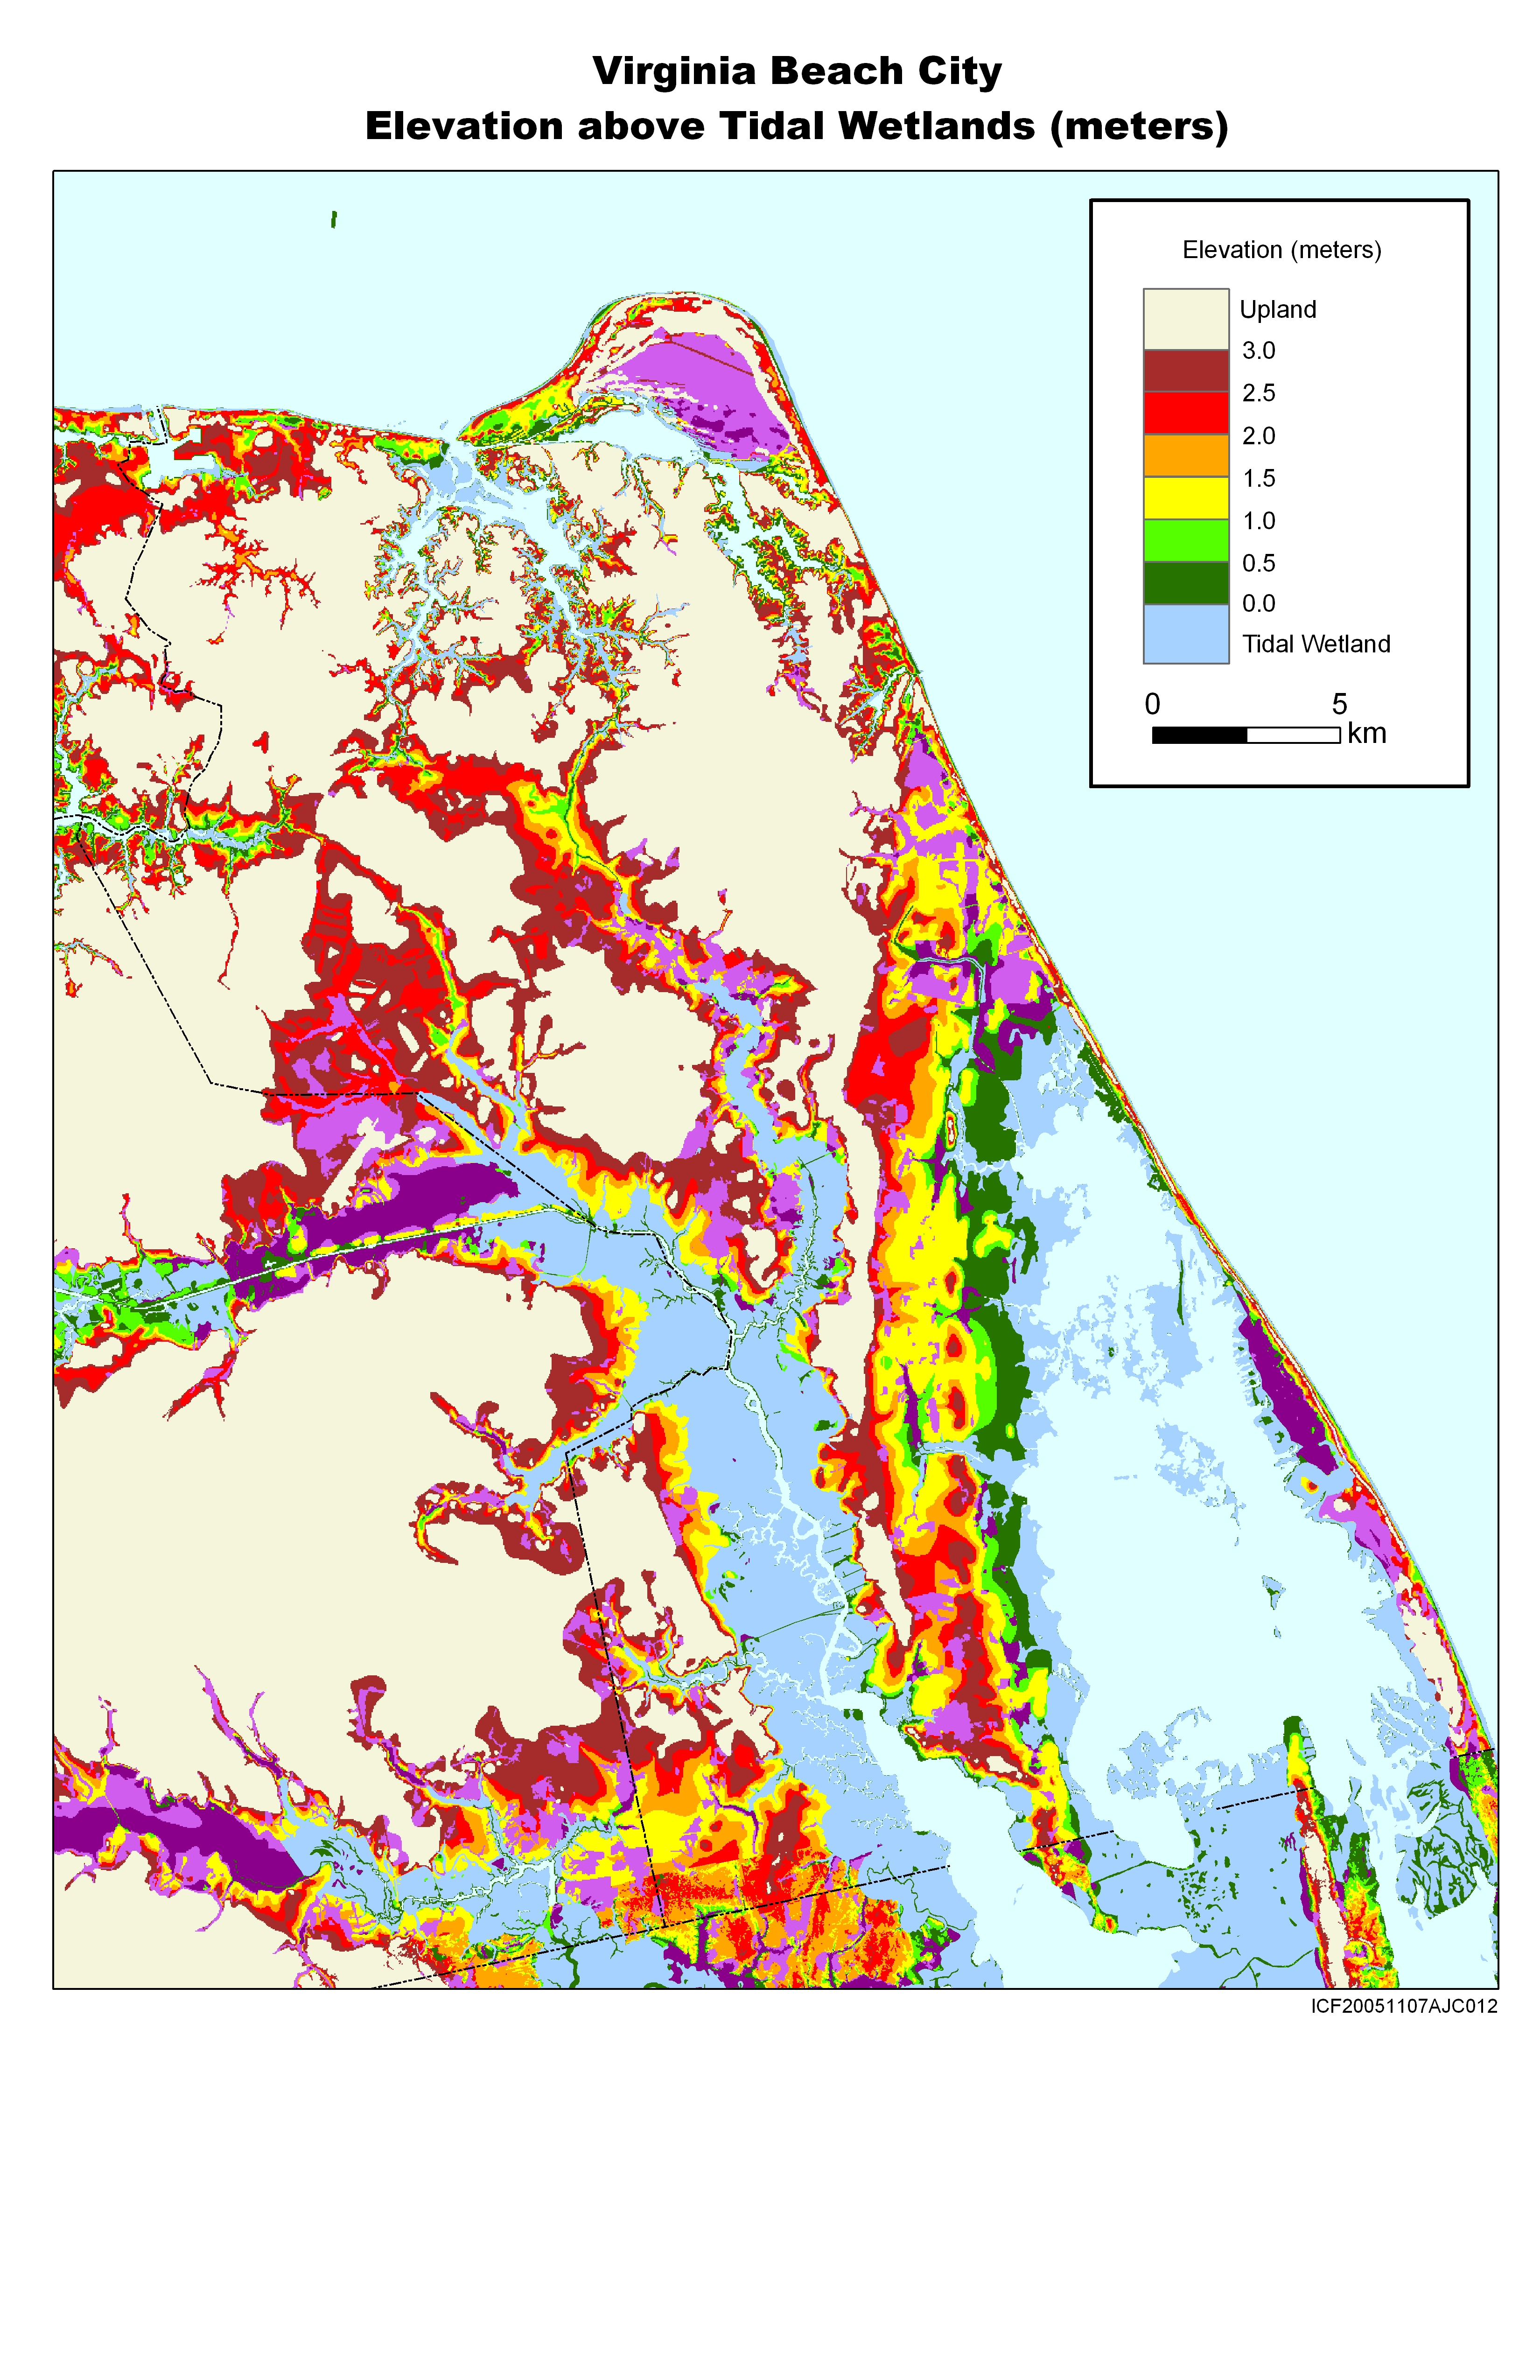
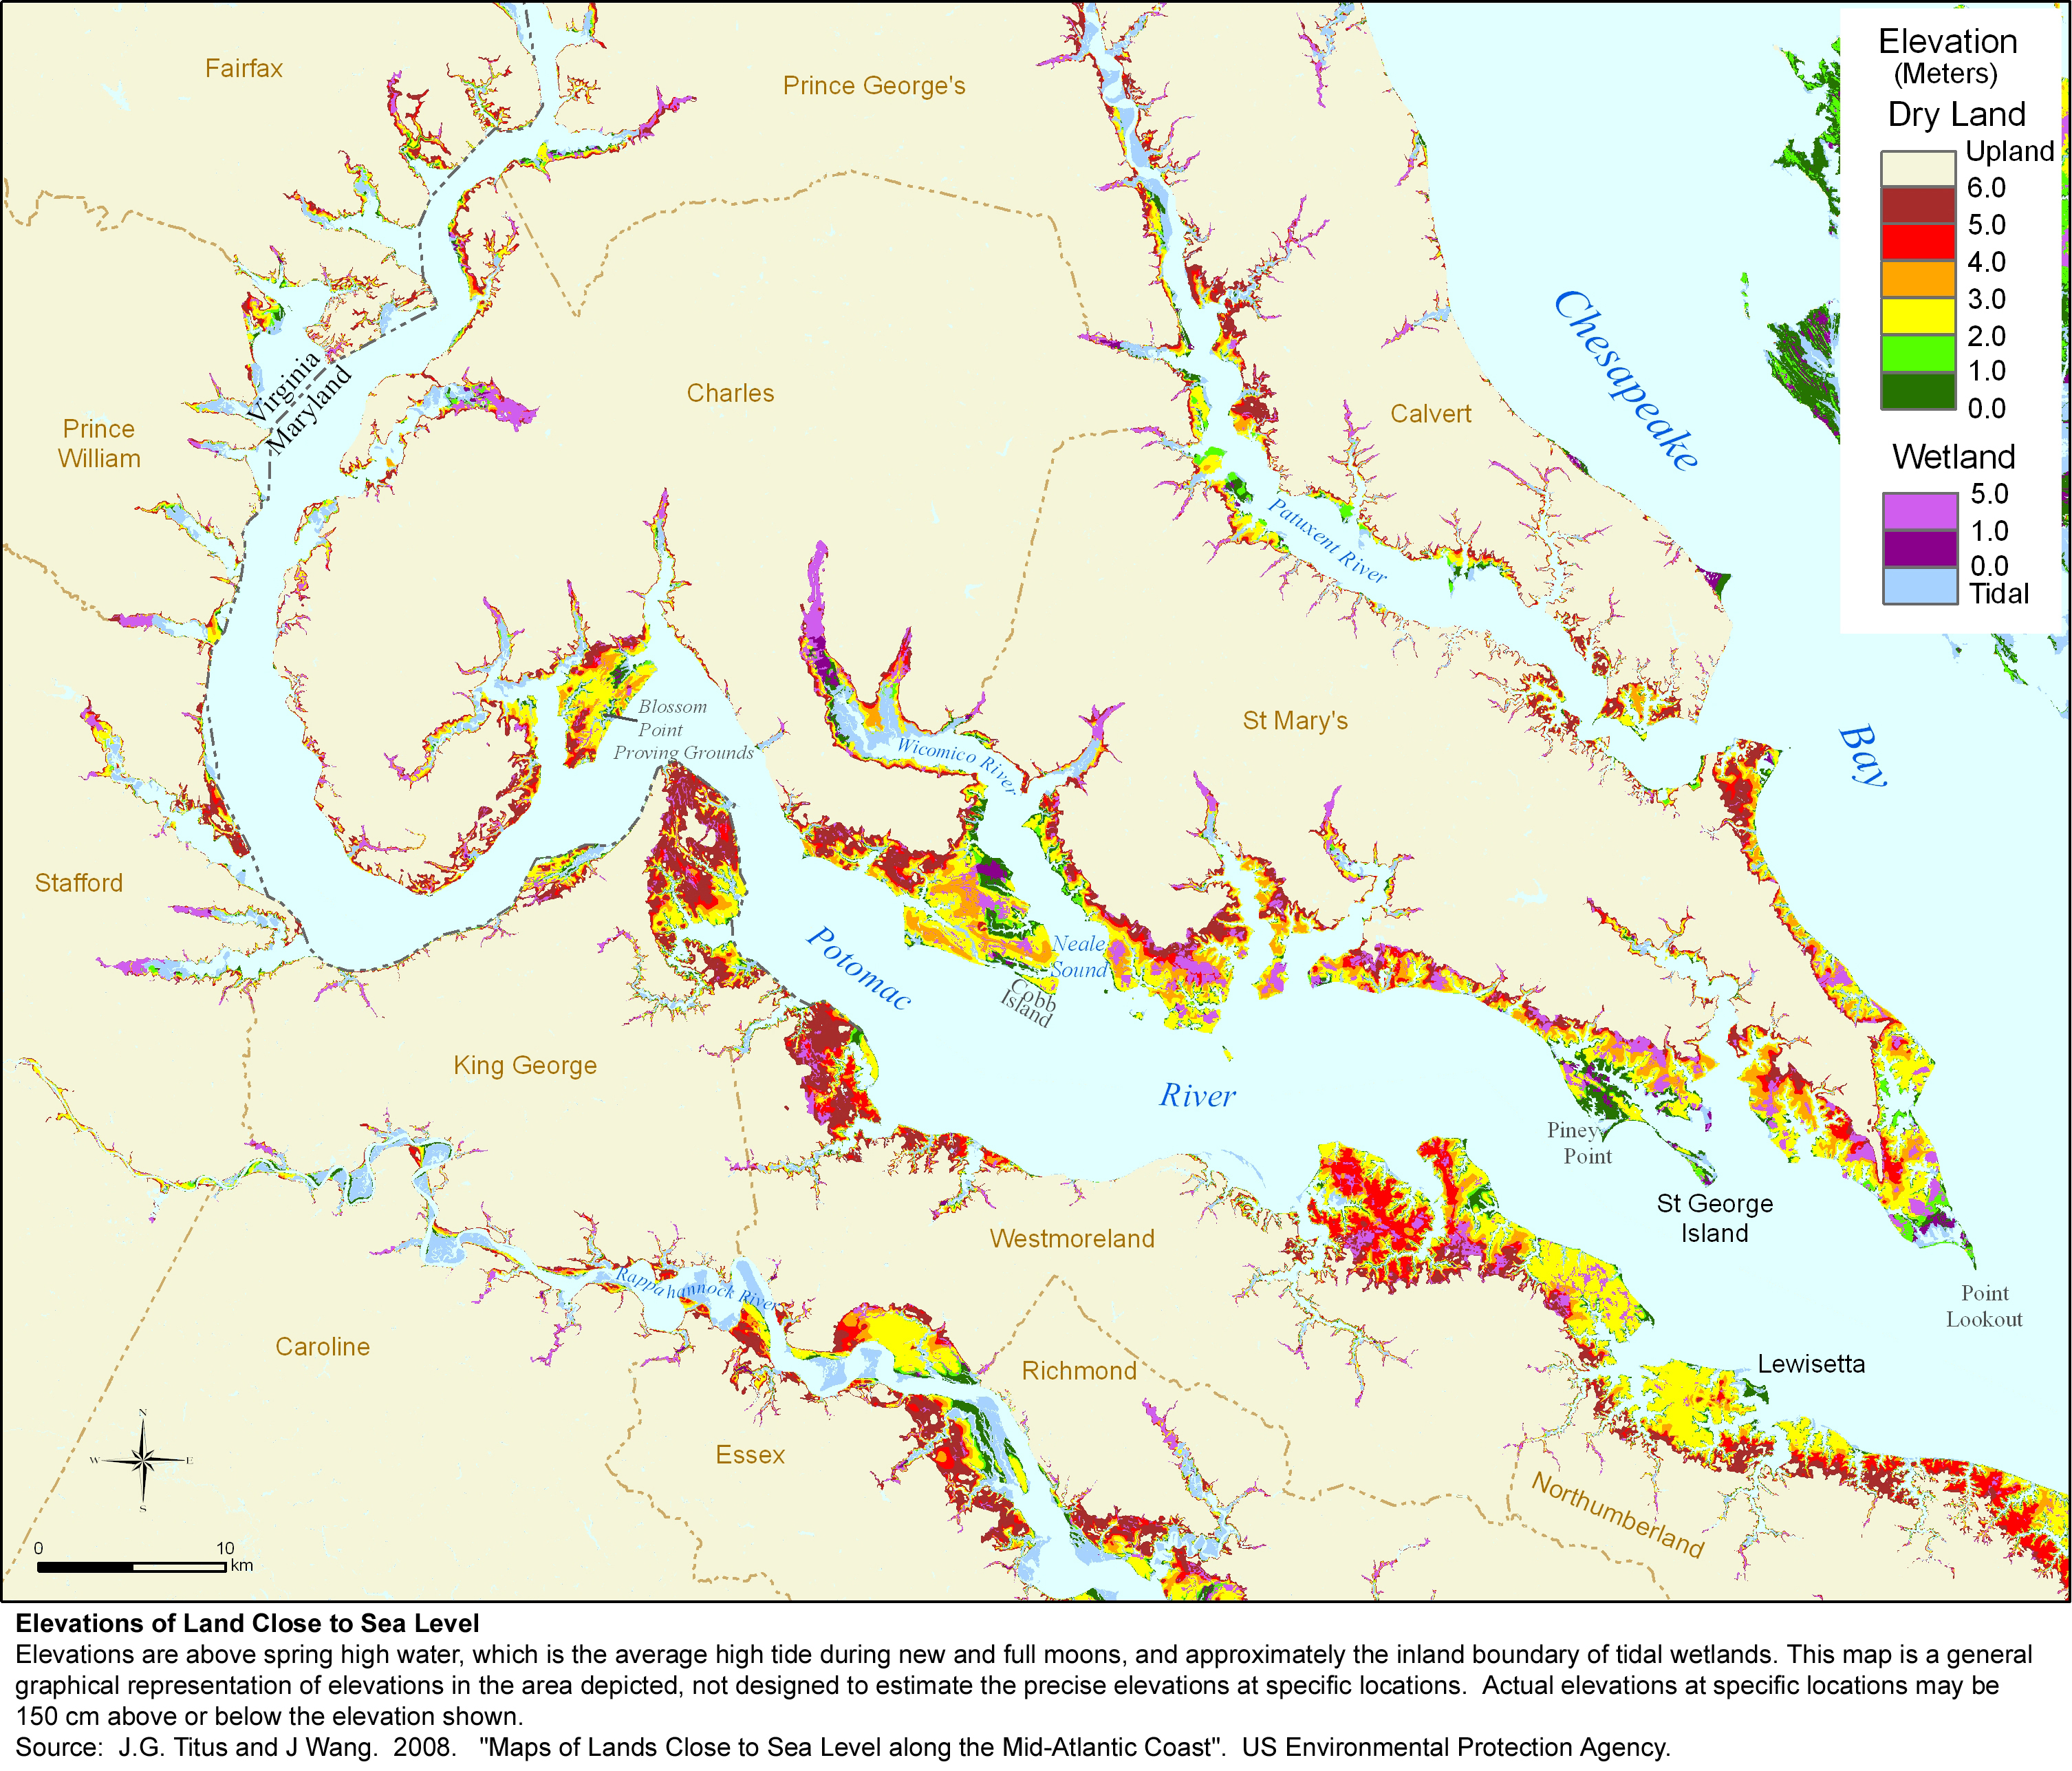
Most of these maps are drawn from an EPA study, which developed county-scale elevation maps to illustrate vulnerability to sea level rise, using existing data. The maps show elevations 
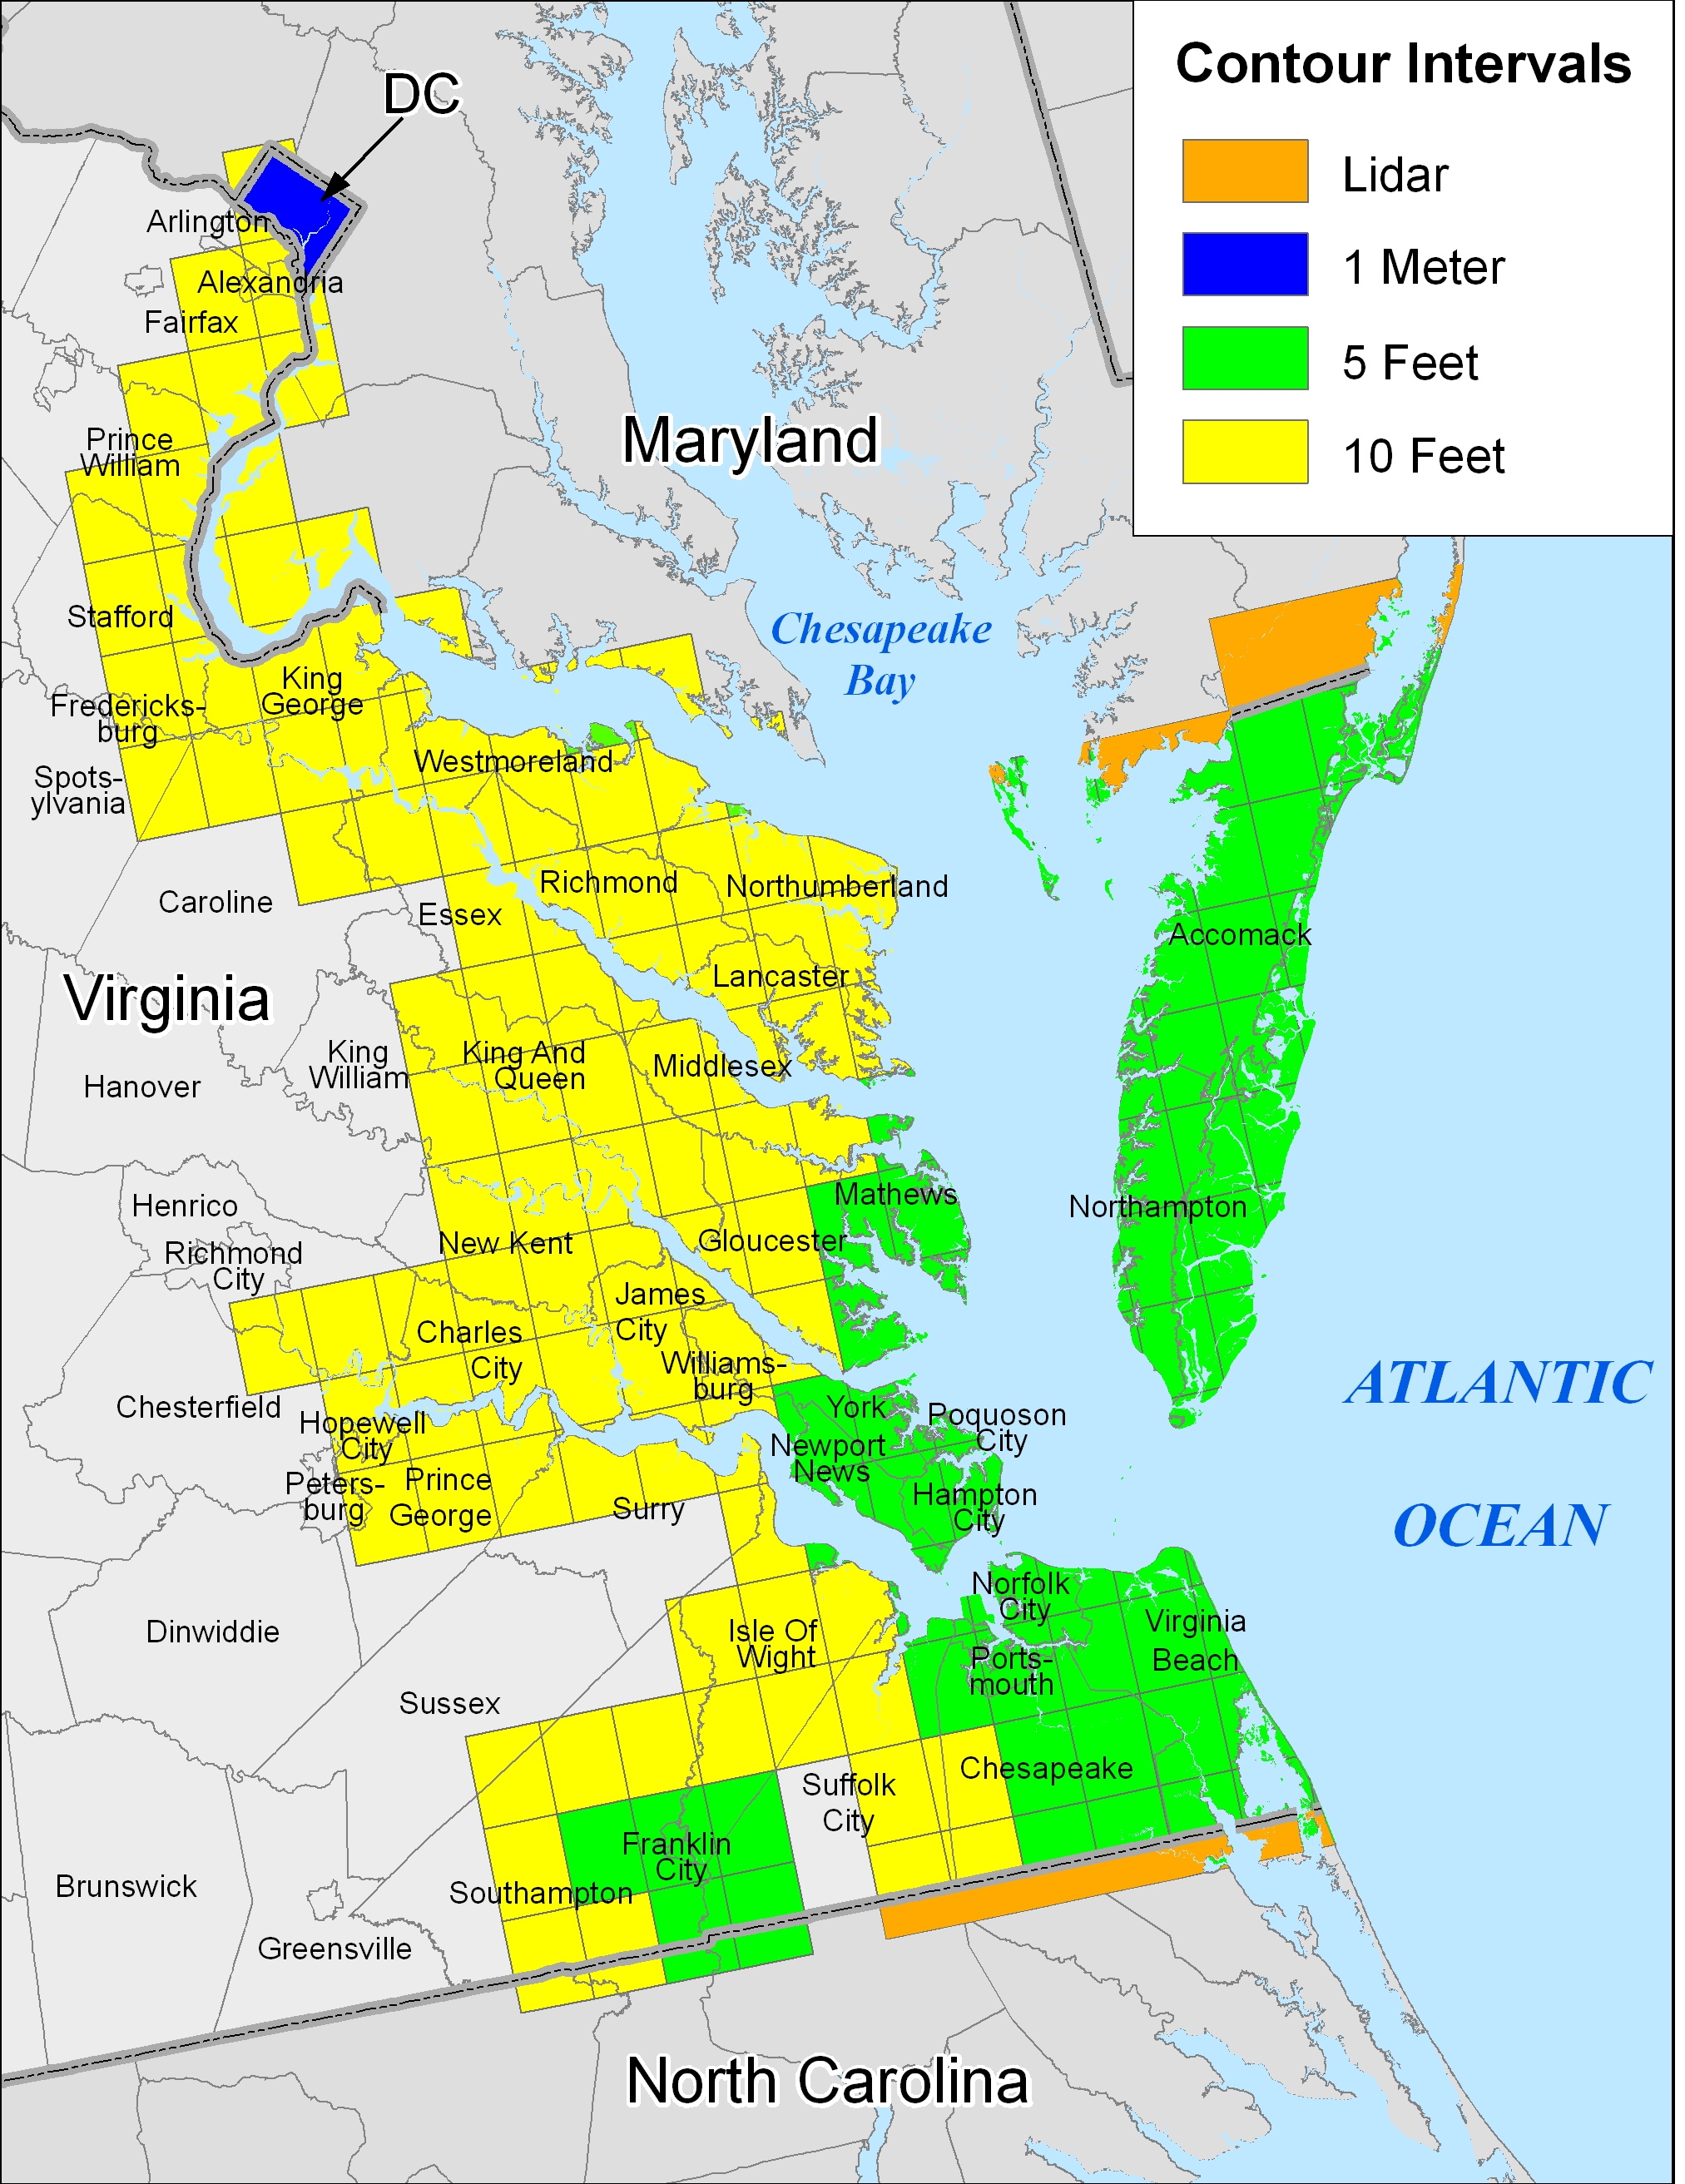
relative to spring high water, the average tide during new and full moons. The accuracy of the data varies, so we have also included an index map showing the data sources, which can help you figure out how accurate our maps are for a particular location.


Virginia sea level rise map, 1-meter contour 


Virginia: 1-meter contour

Virginia 50-cm contour with nontidal wetlands 


Virginia: 50-cm contour


Virginia 50-cm contour
with nontidal wetlands

Accomack County and Northamption County 


Virginia Eastern Shore:
50-cm contour

Potomac River from Point Lookout to Broad Creek: vulnerability to sea level rise


Lower Potomac River

Potomac River: Blossom Point to the DC Line, vulnerability to sea level rise


Upper Potomac River


Hampton Roads
Virginia


Northern Neck and
Middle Peninsula
Virginia

Accomack County


Accomack County

Alexandria


Alexandria

Gloucester 


Gloucester County


James City County

York County


York County

Poquoson


Poquoson

Virginia Beach


Virginia Beach


Data Source
Index Map