Maps Depicting different aspects of Wetland Vulnerability from various EPA studies
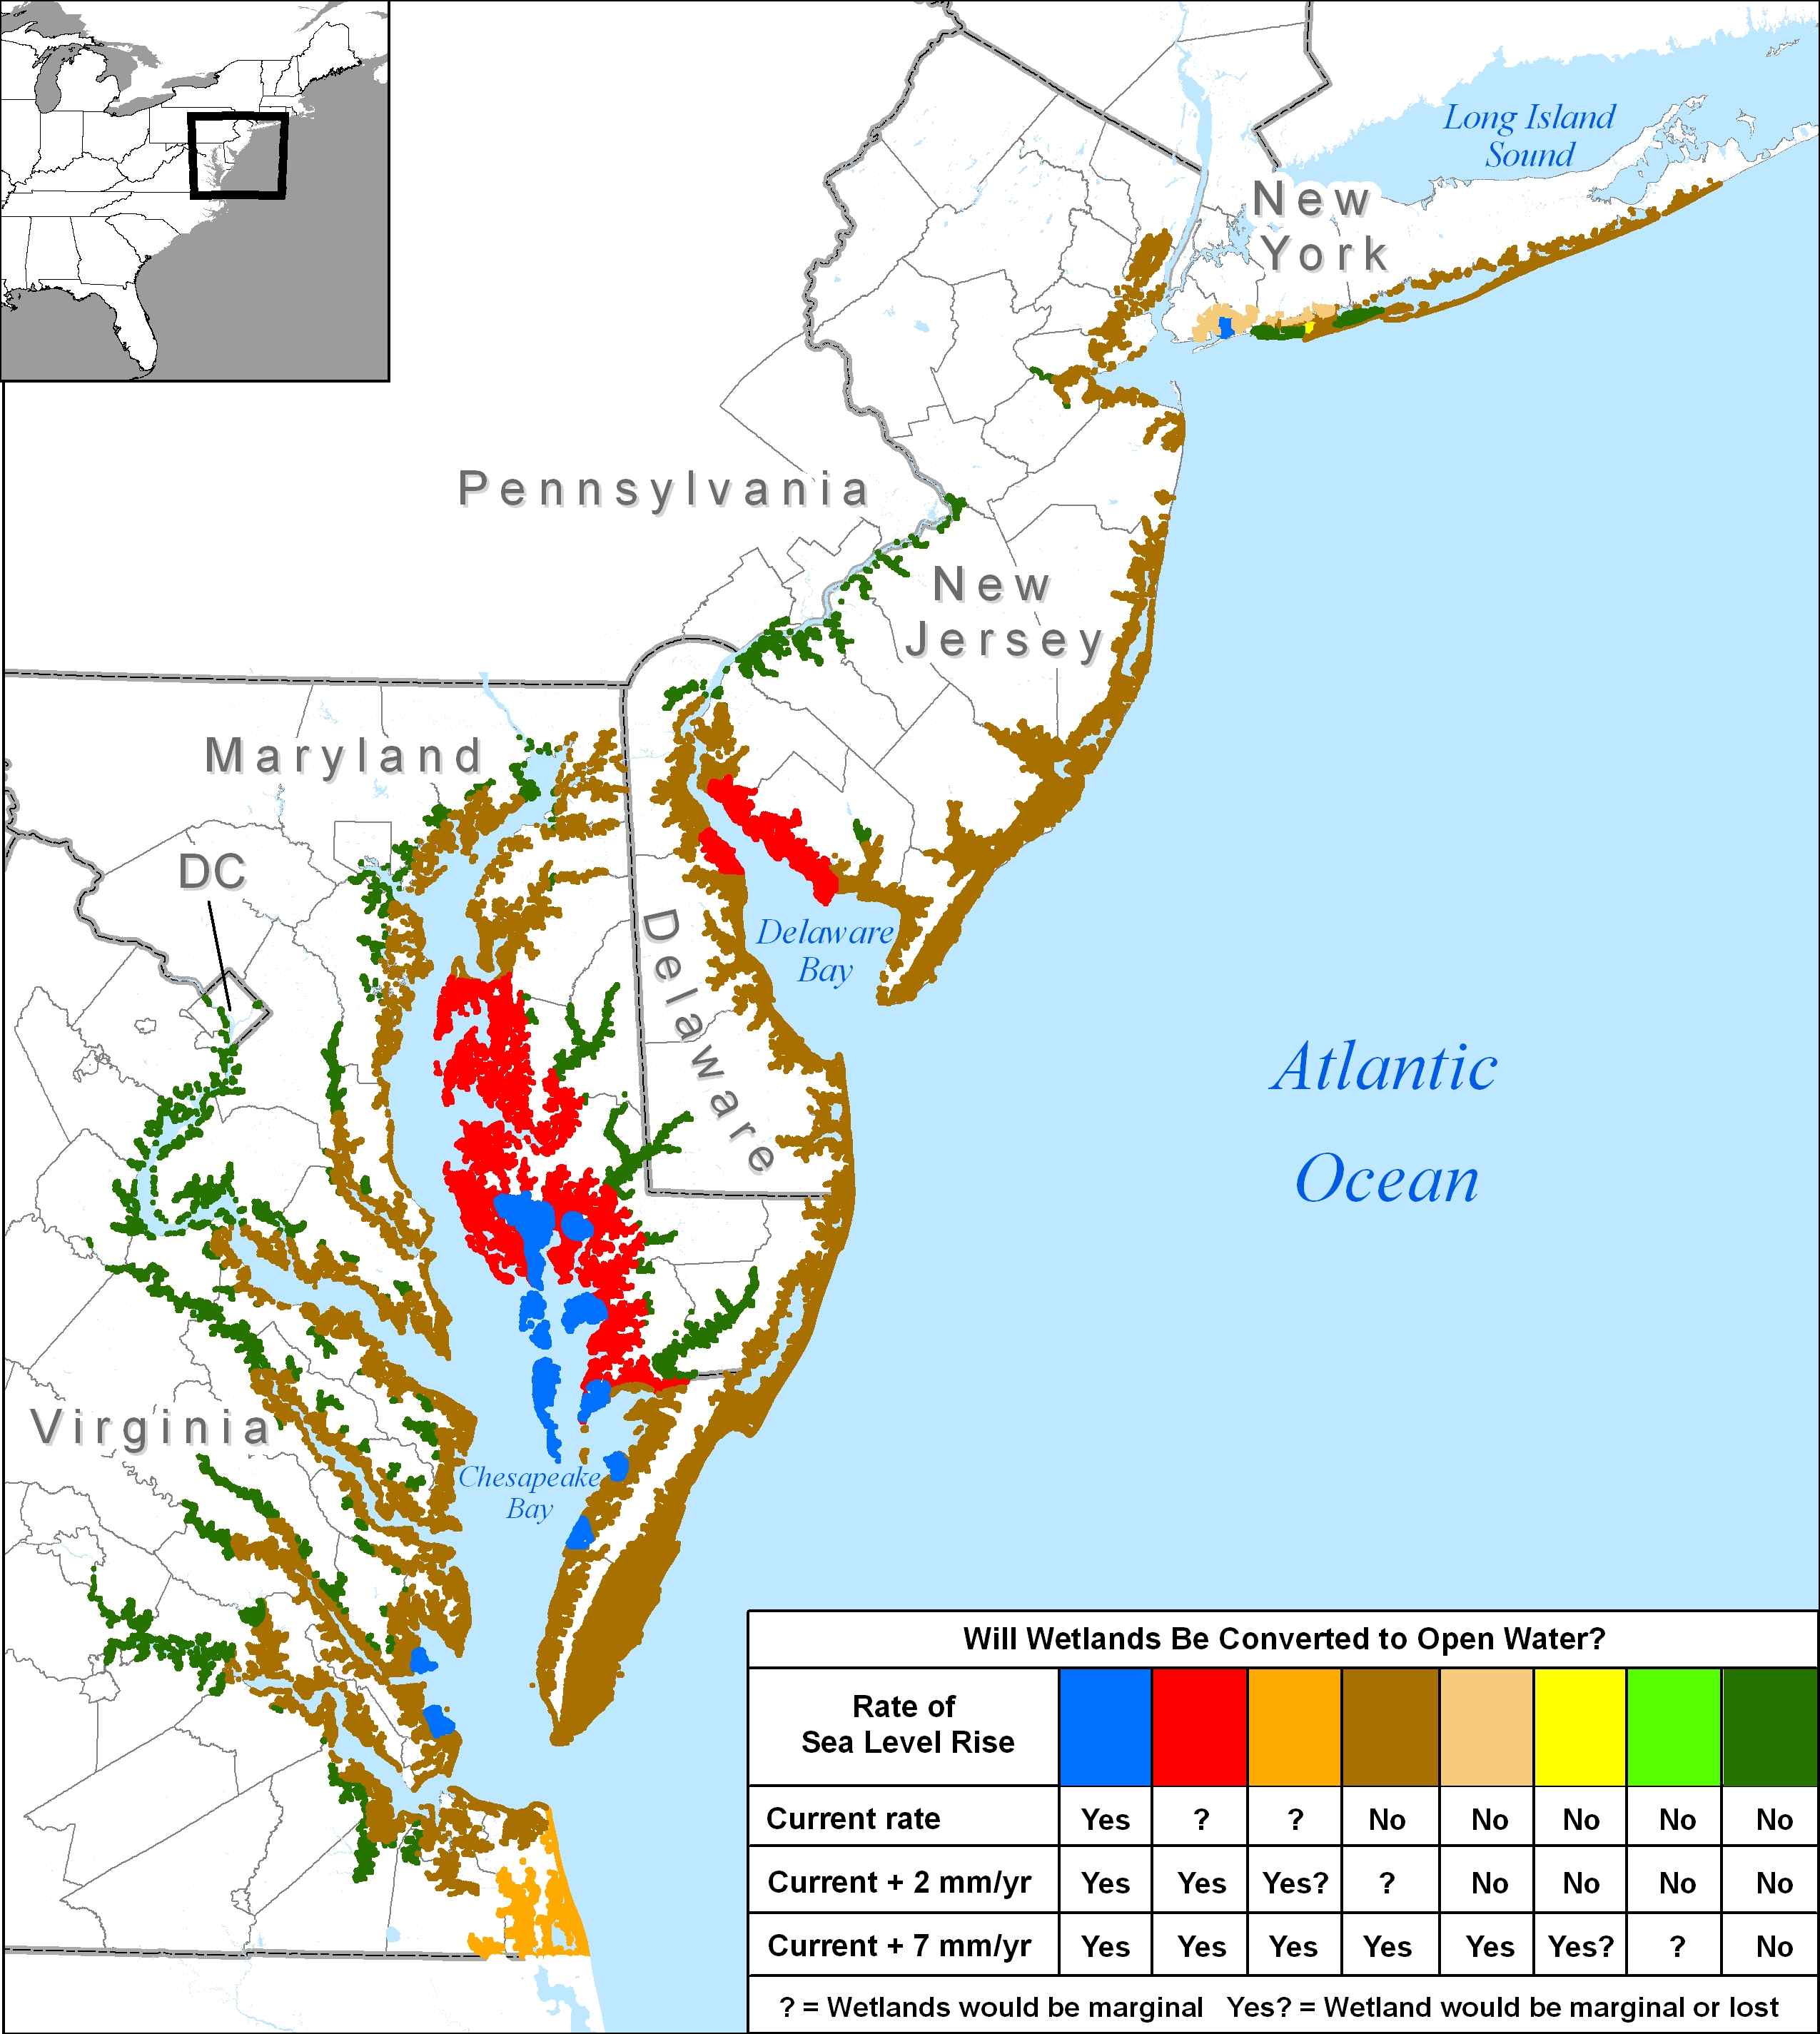
The loss of wetlands as sea level rise depends mostly on the area of wetlands that convert to open water as they are submerged, and the creation of new wetlands as previously dry areas close to sea level are submerged. Figure 1 depicts the best guess of the vulnerability of existing wetlands to rising sea level in a panel organized by Denise Reed of the University of New Orleans, published in an EPA report about wetland accretion.
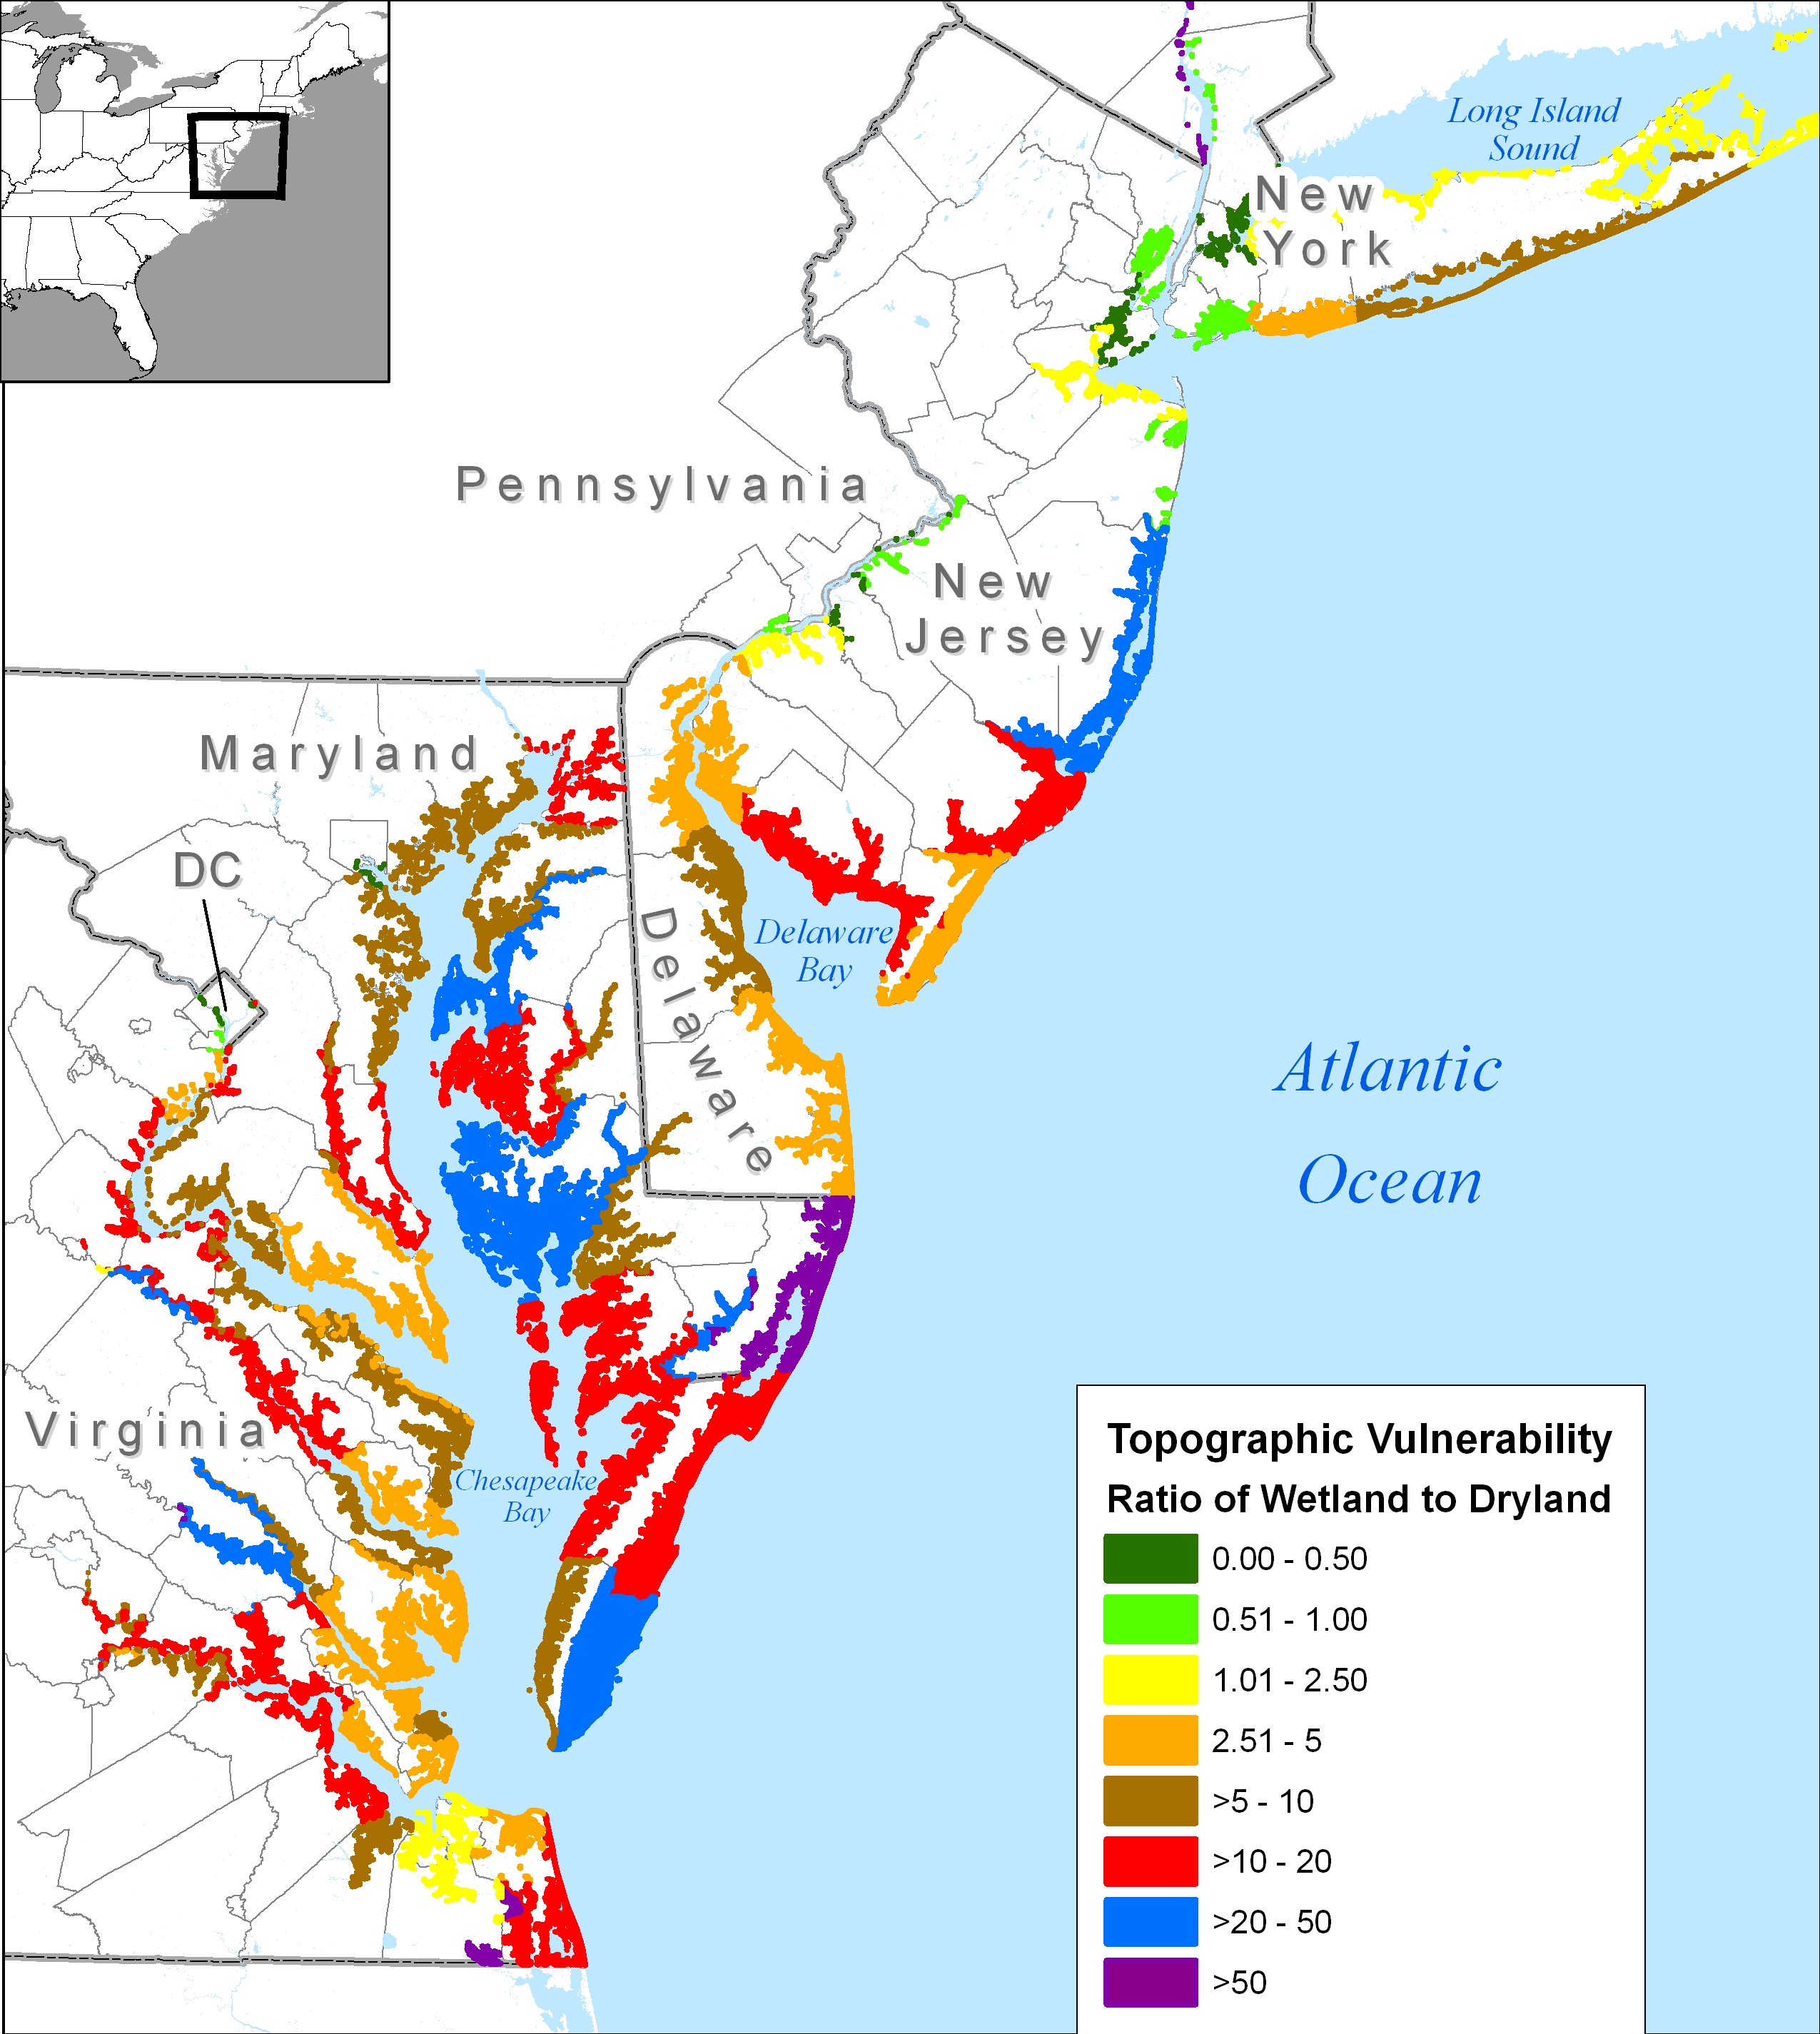
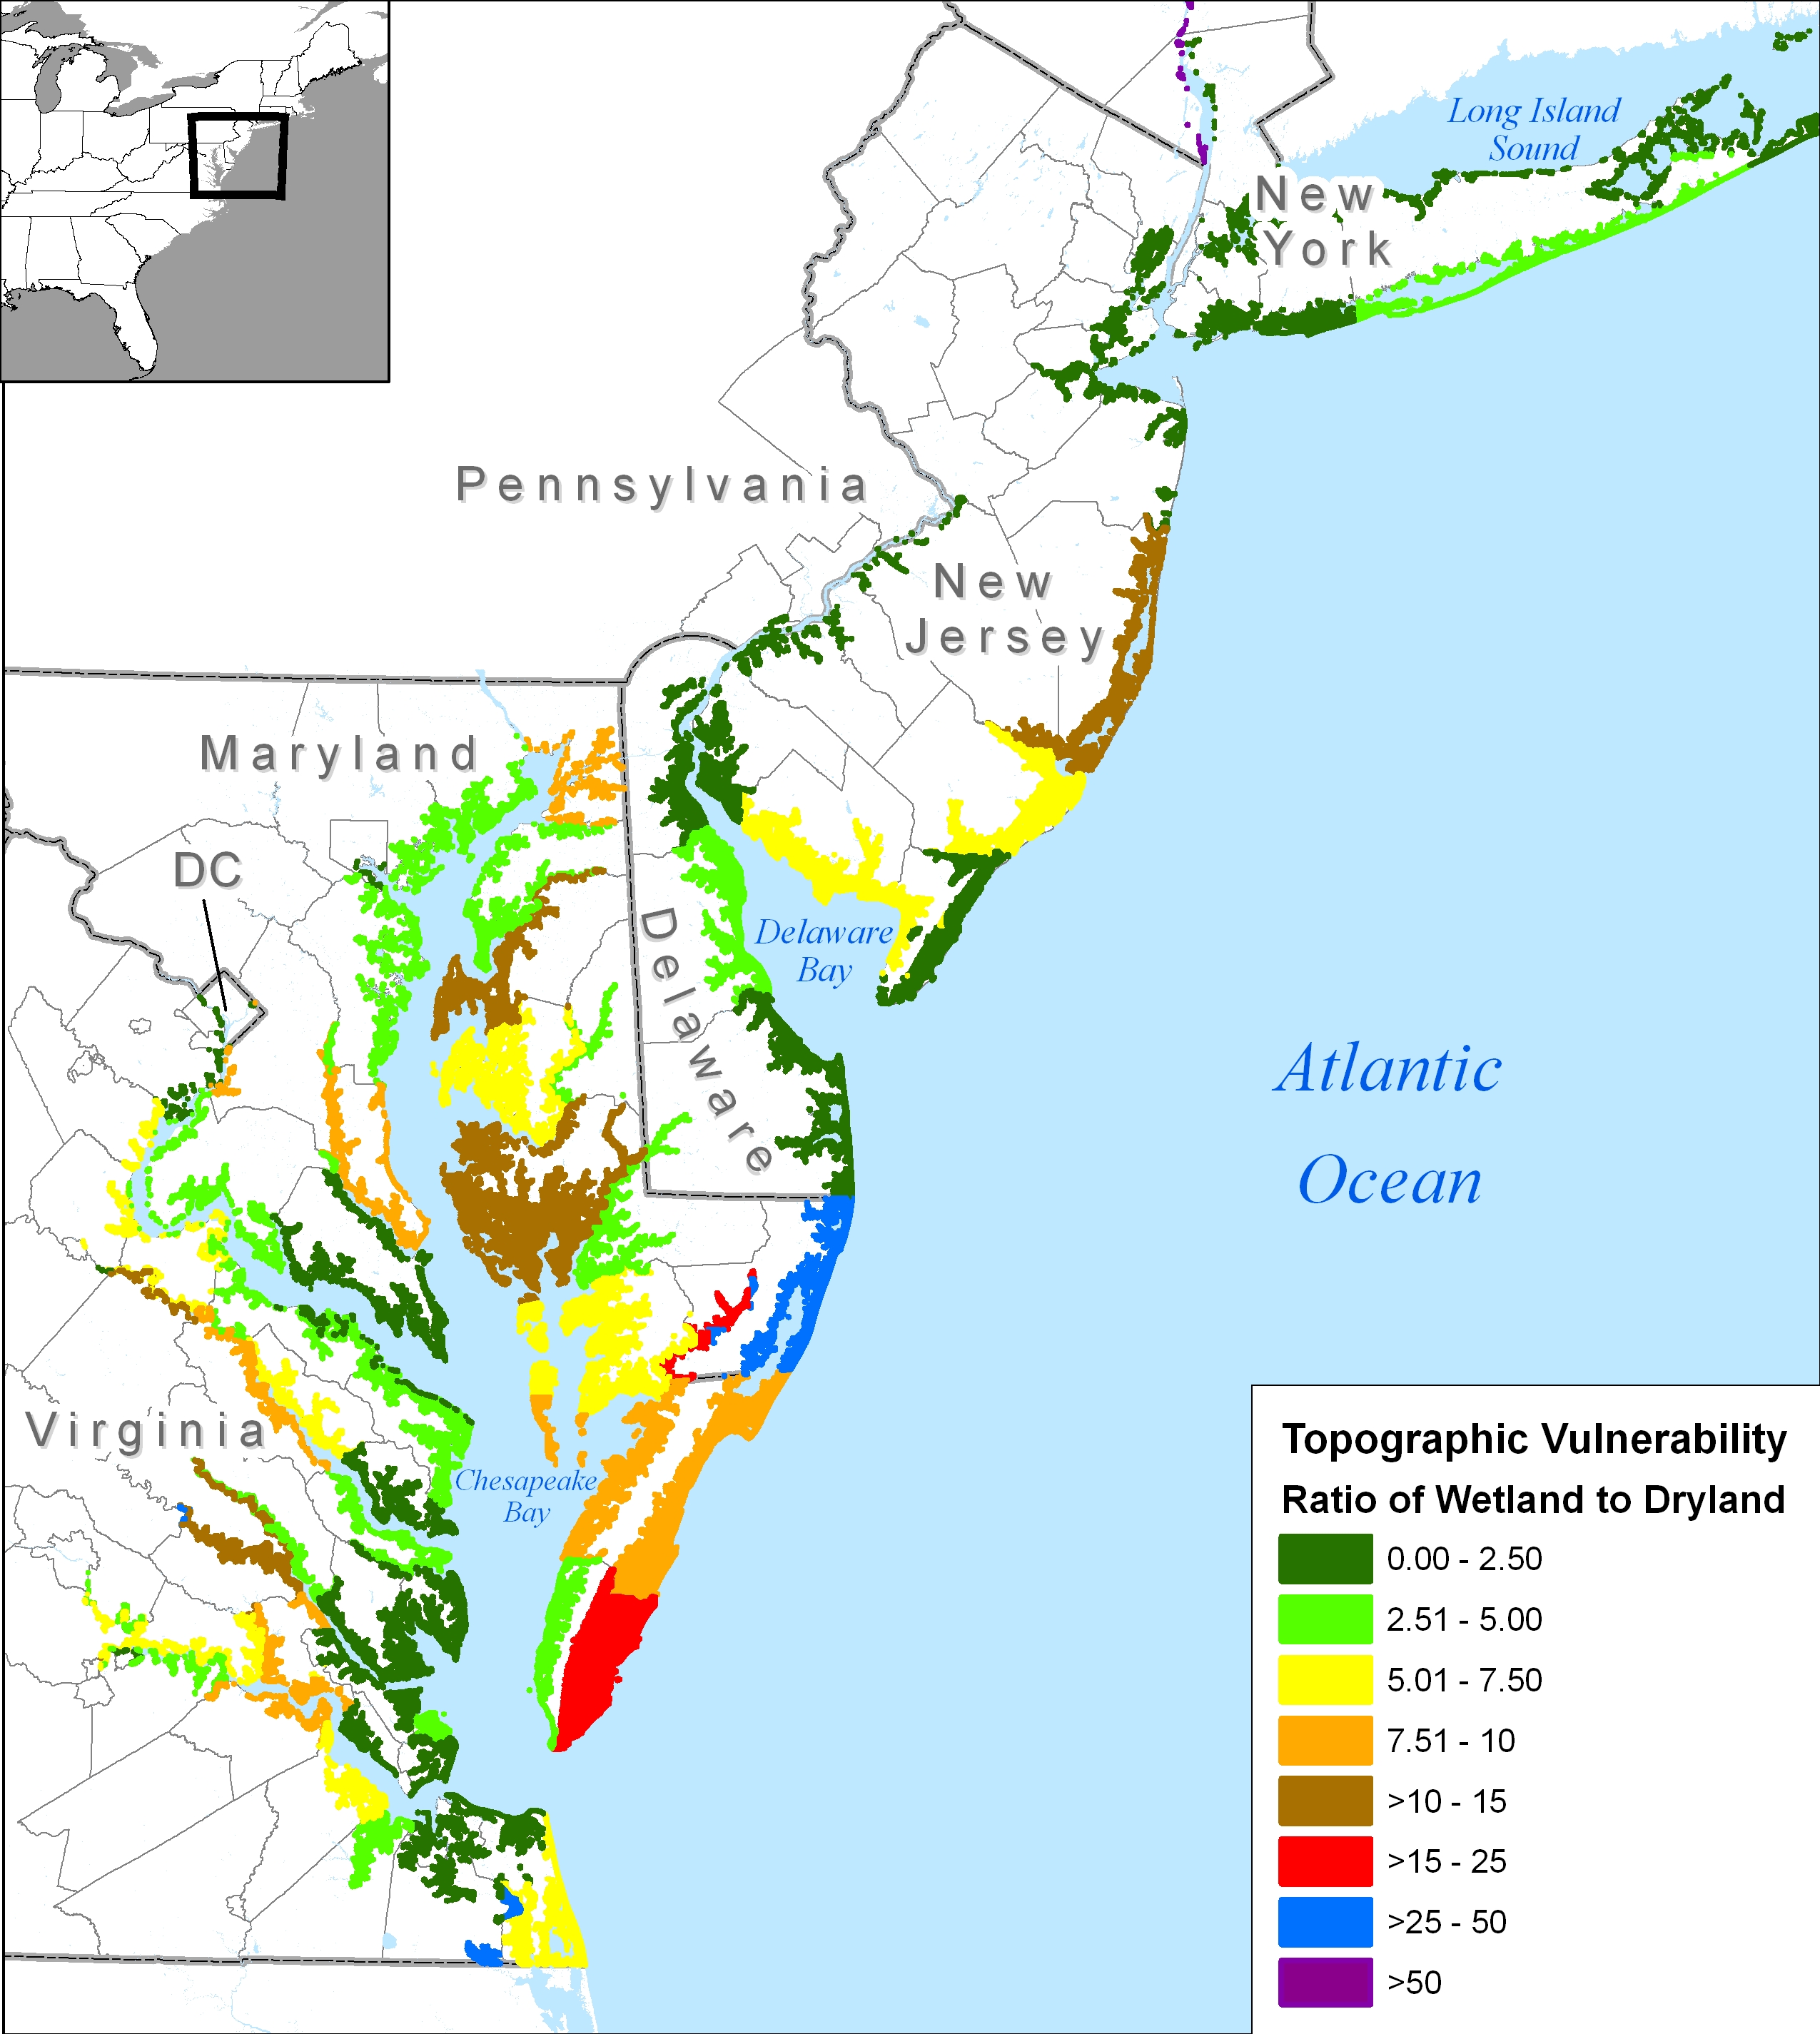
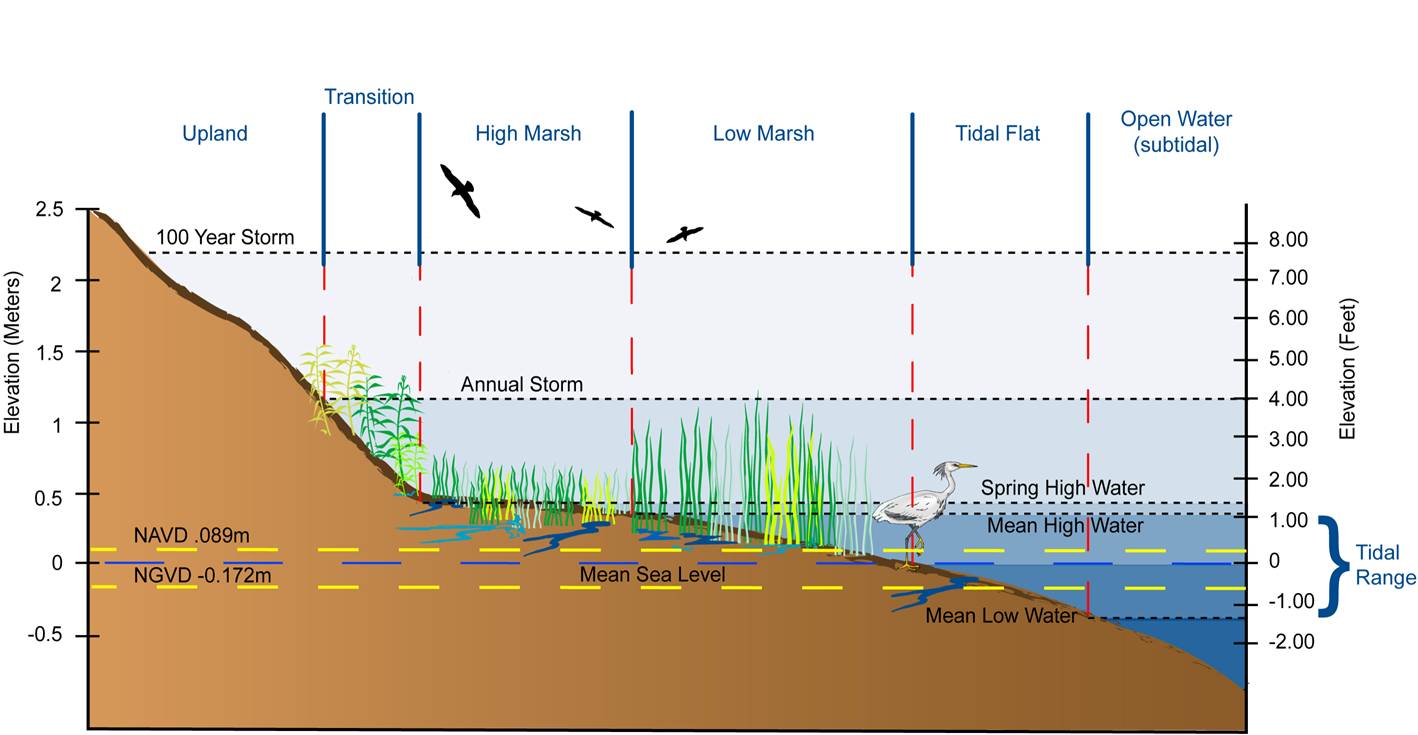
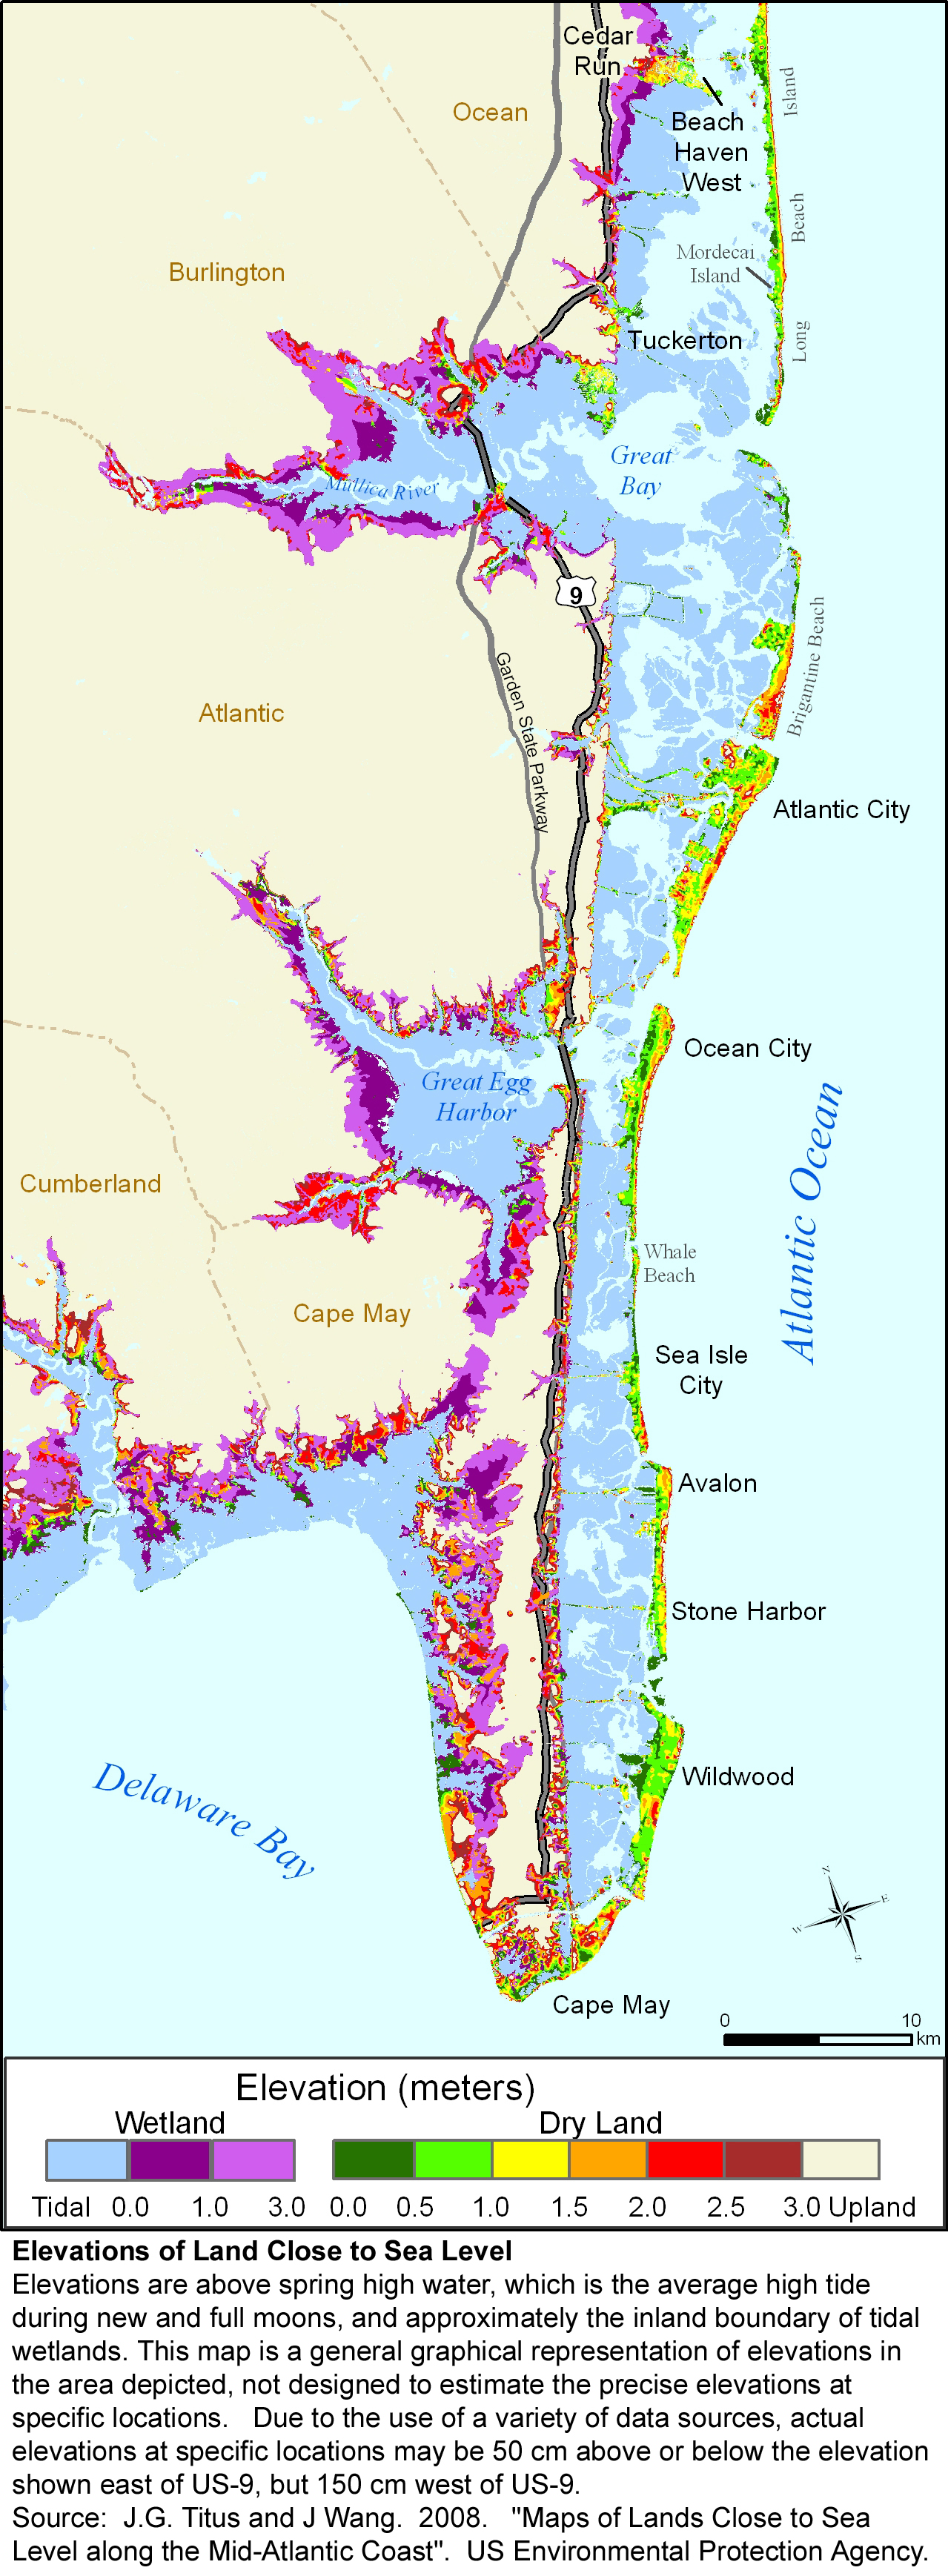
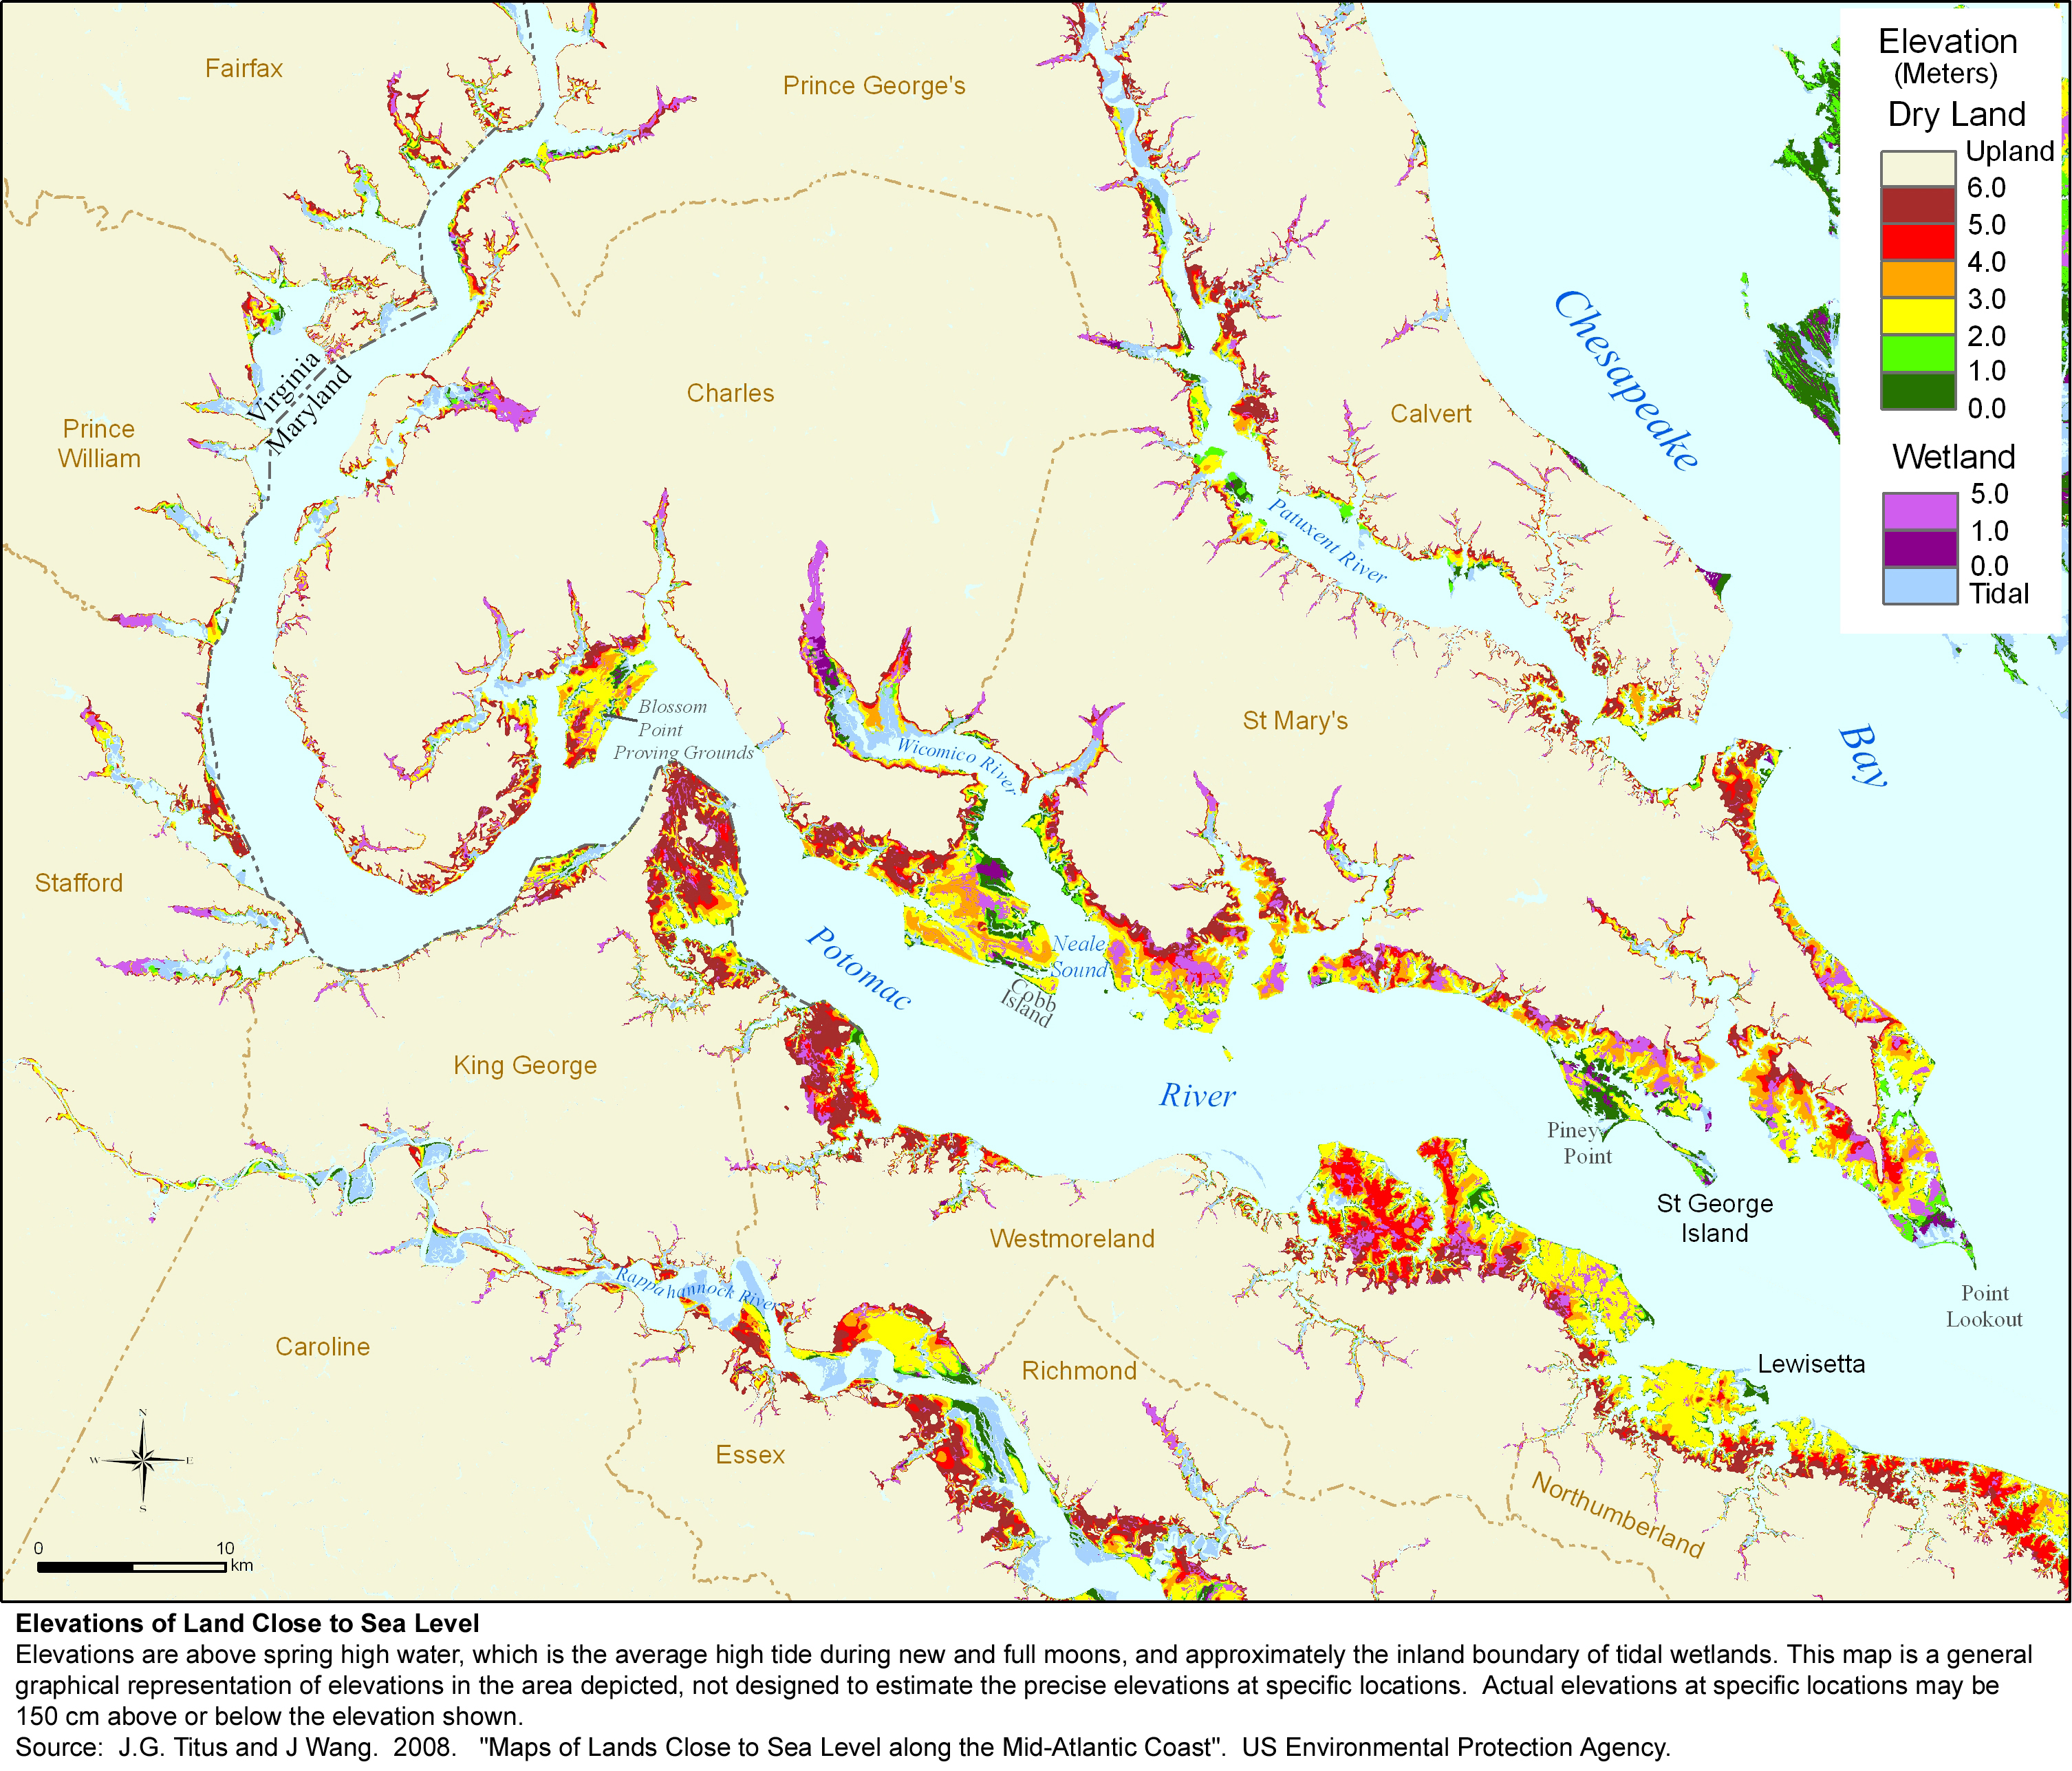
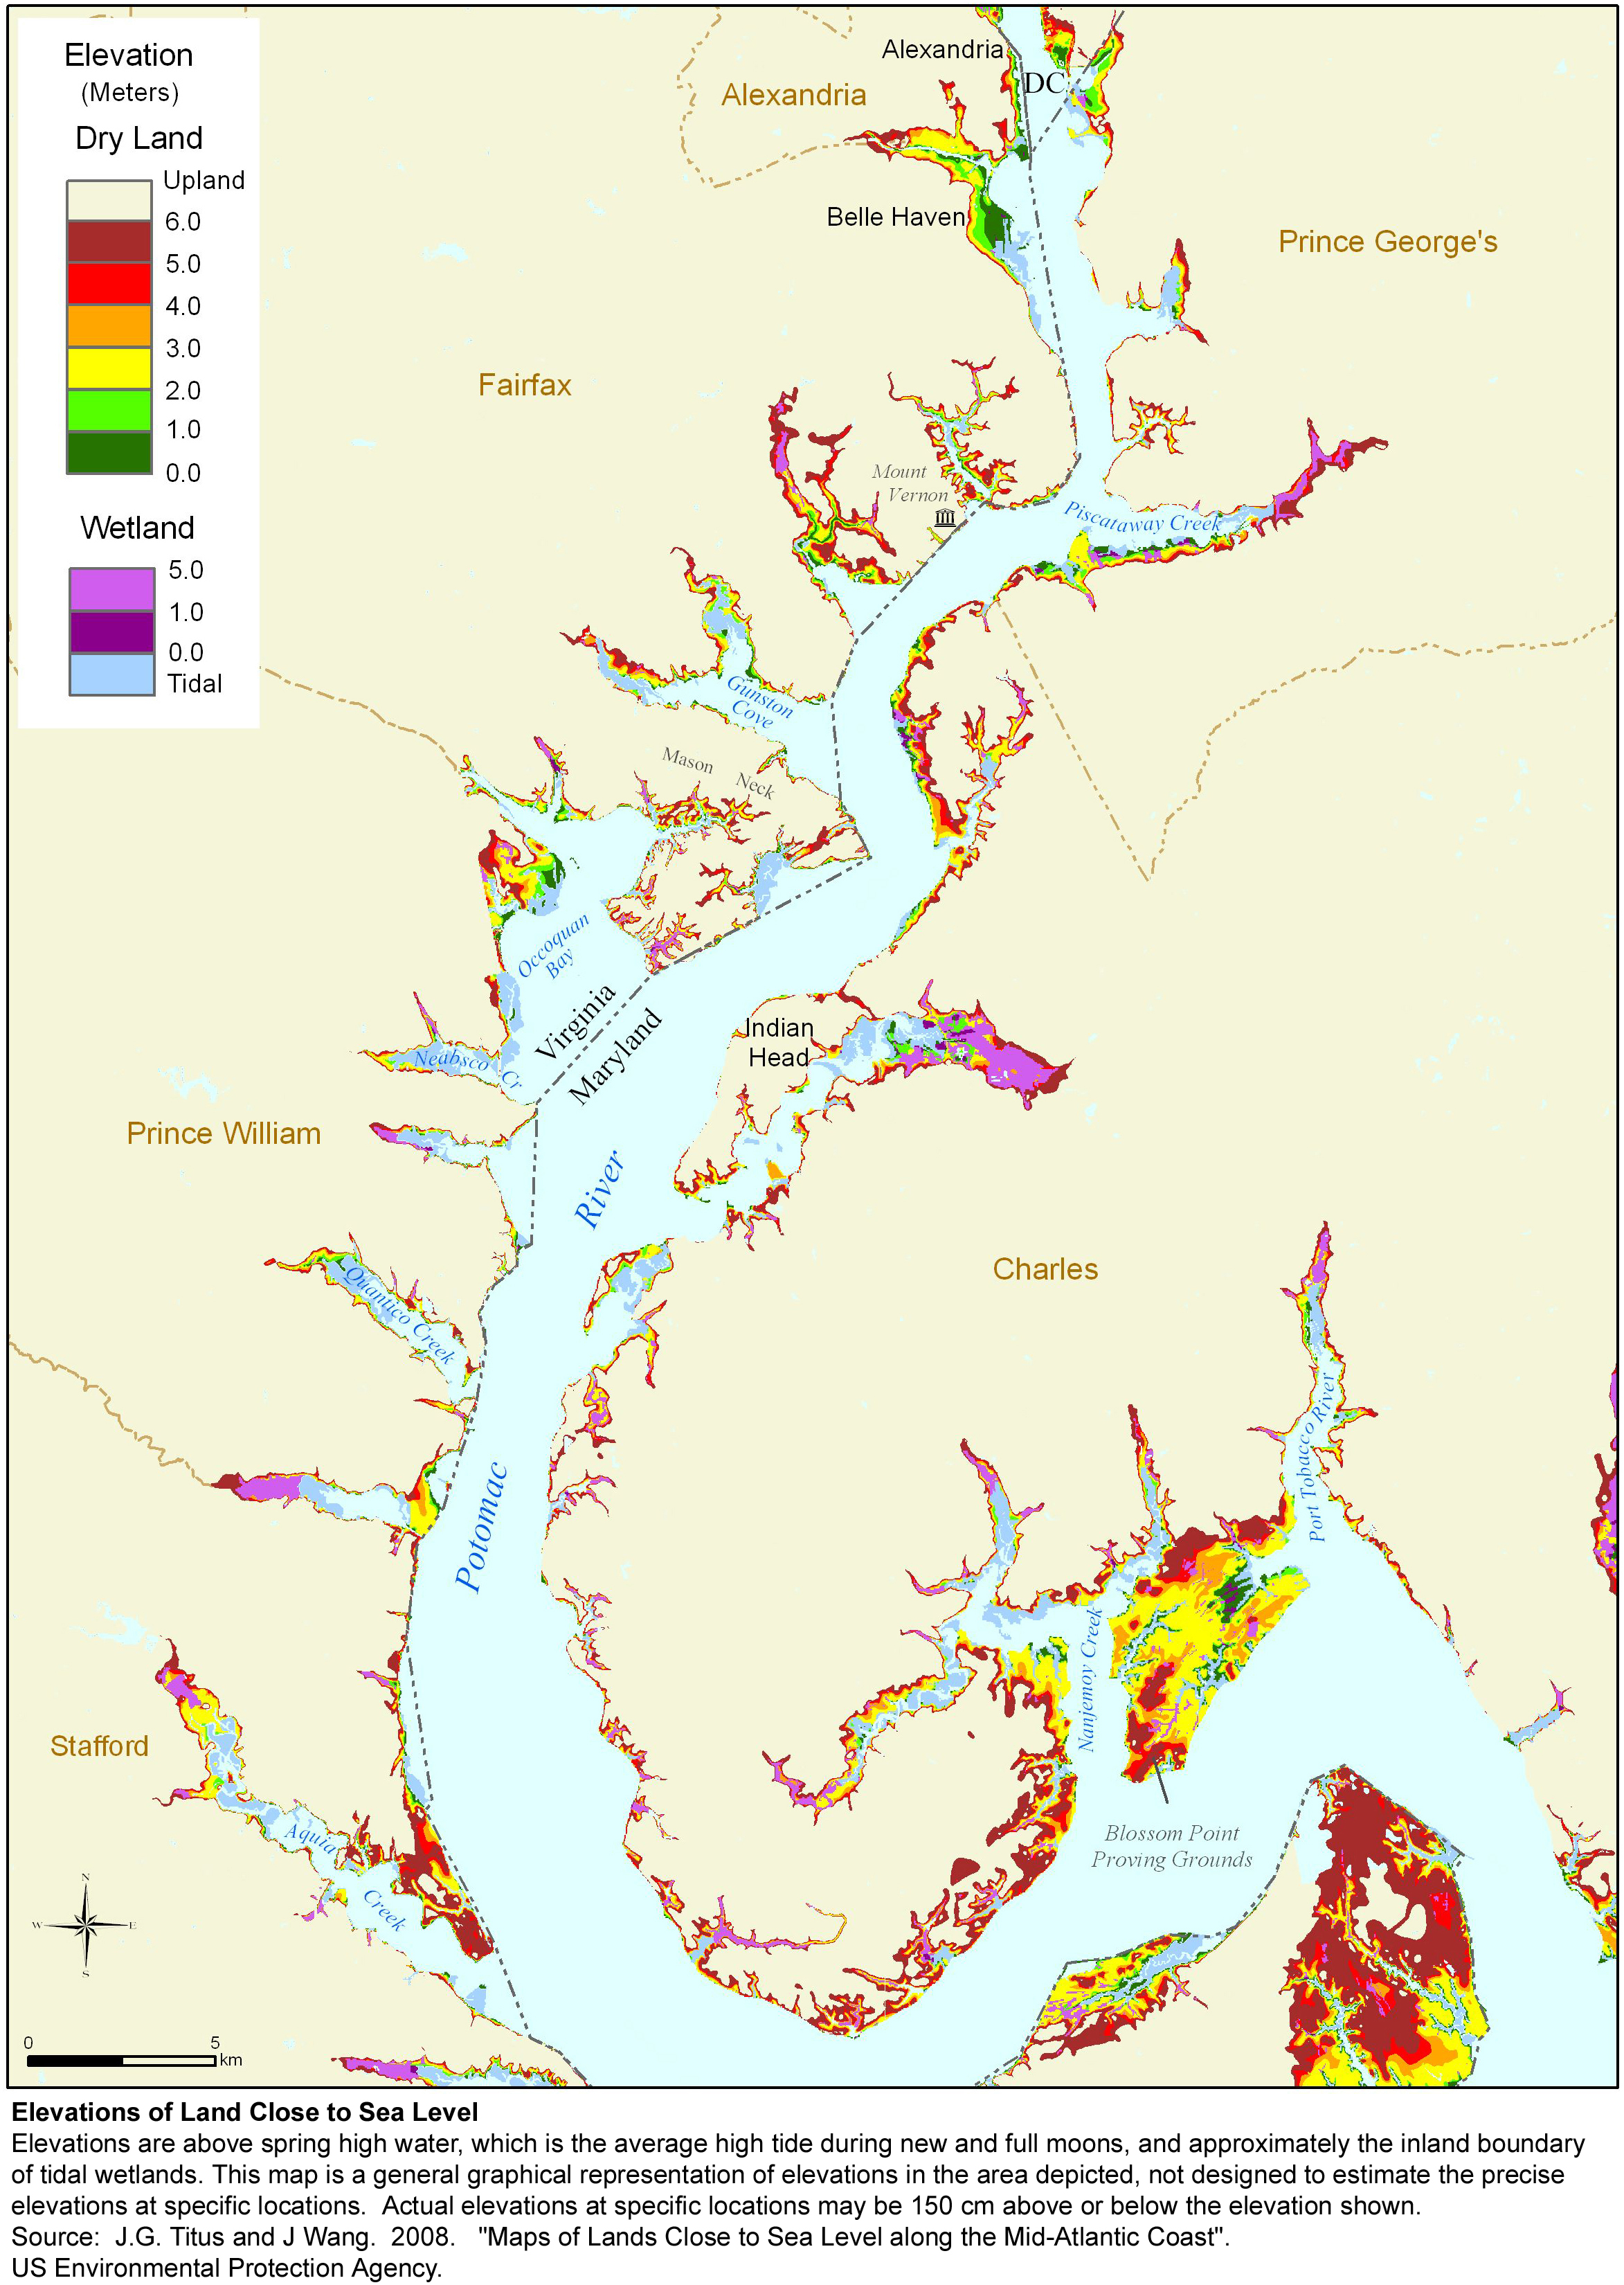
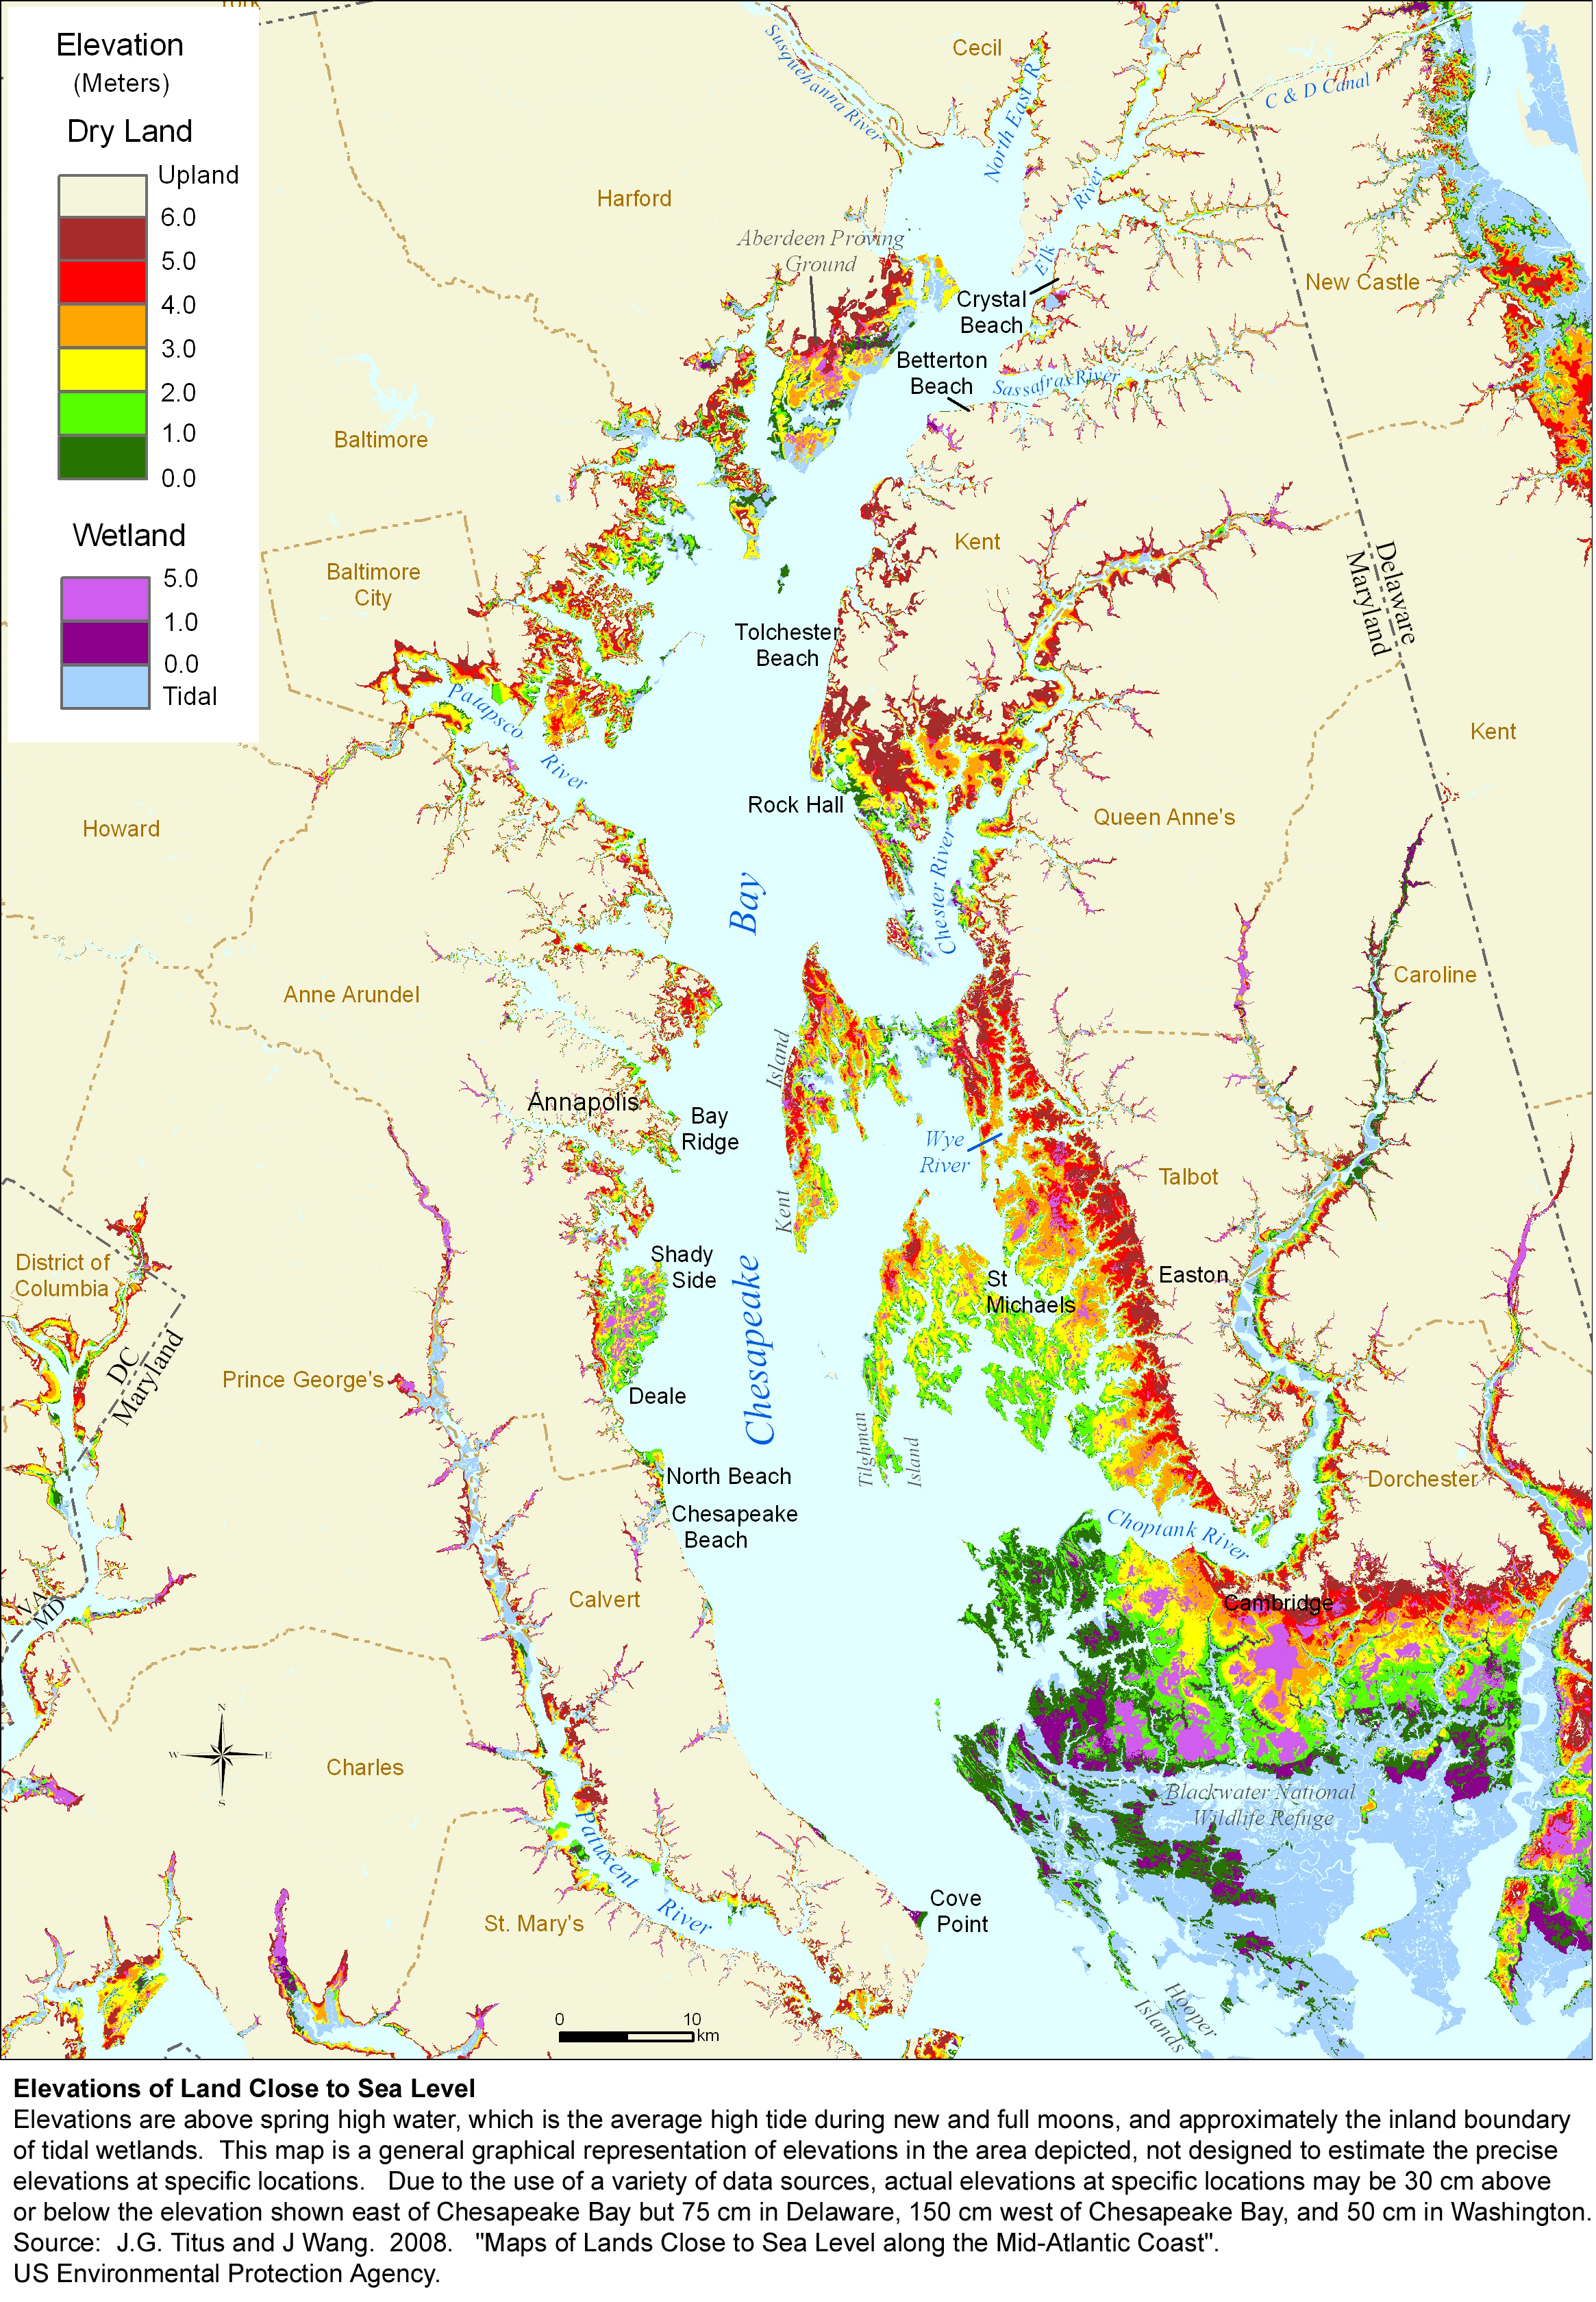
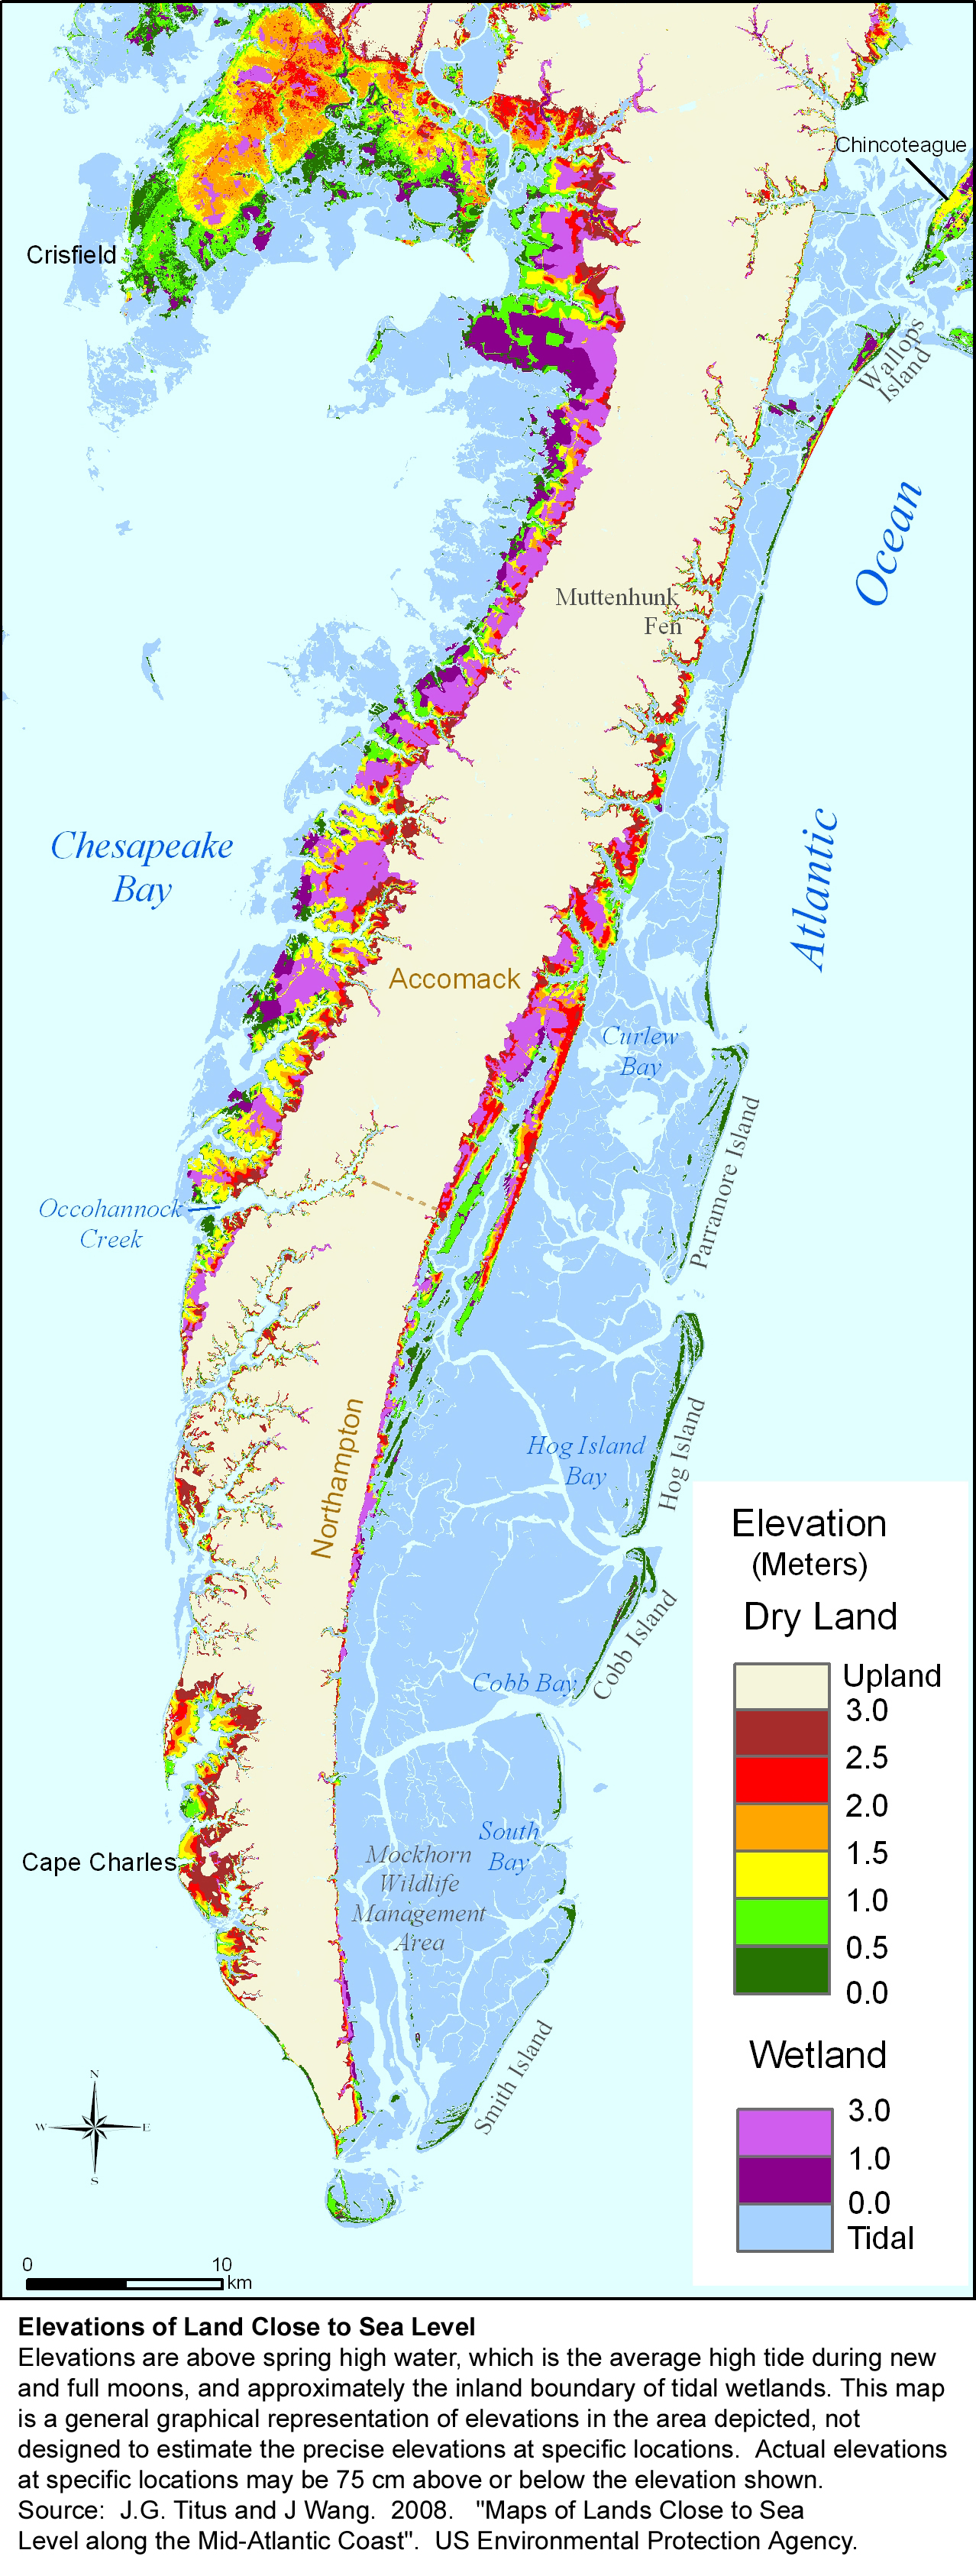
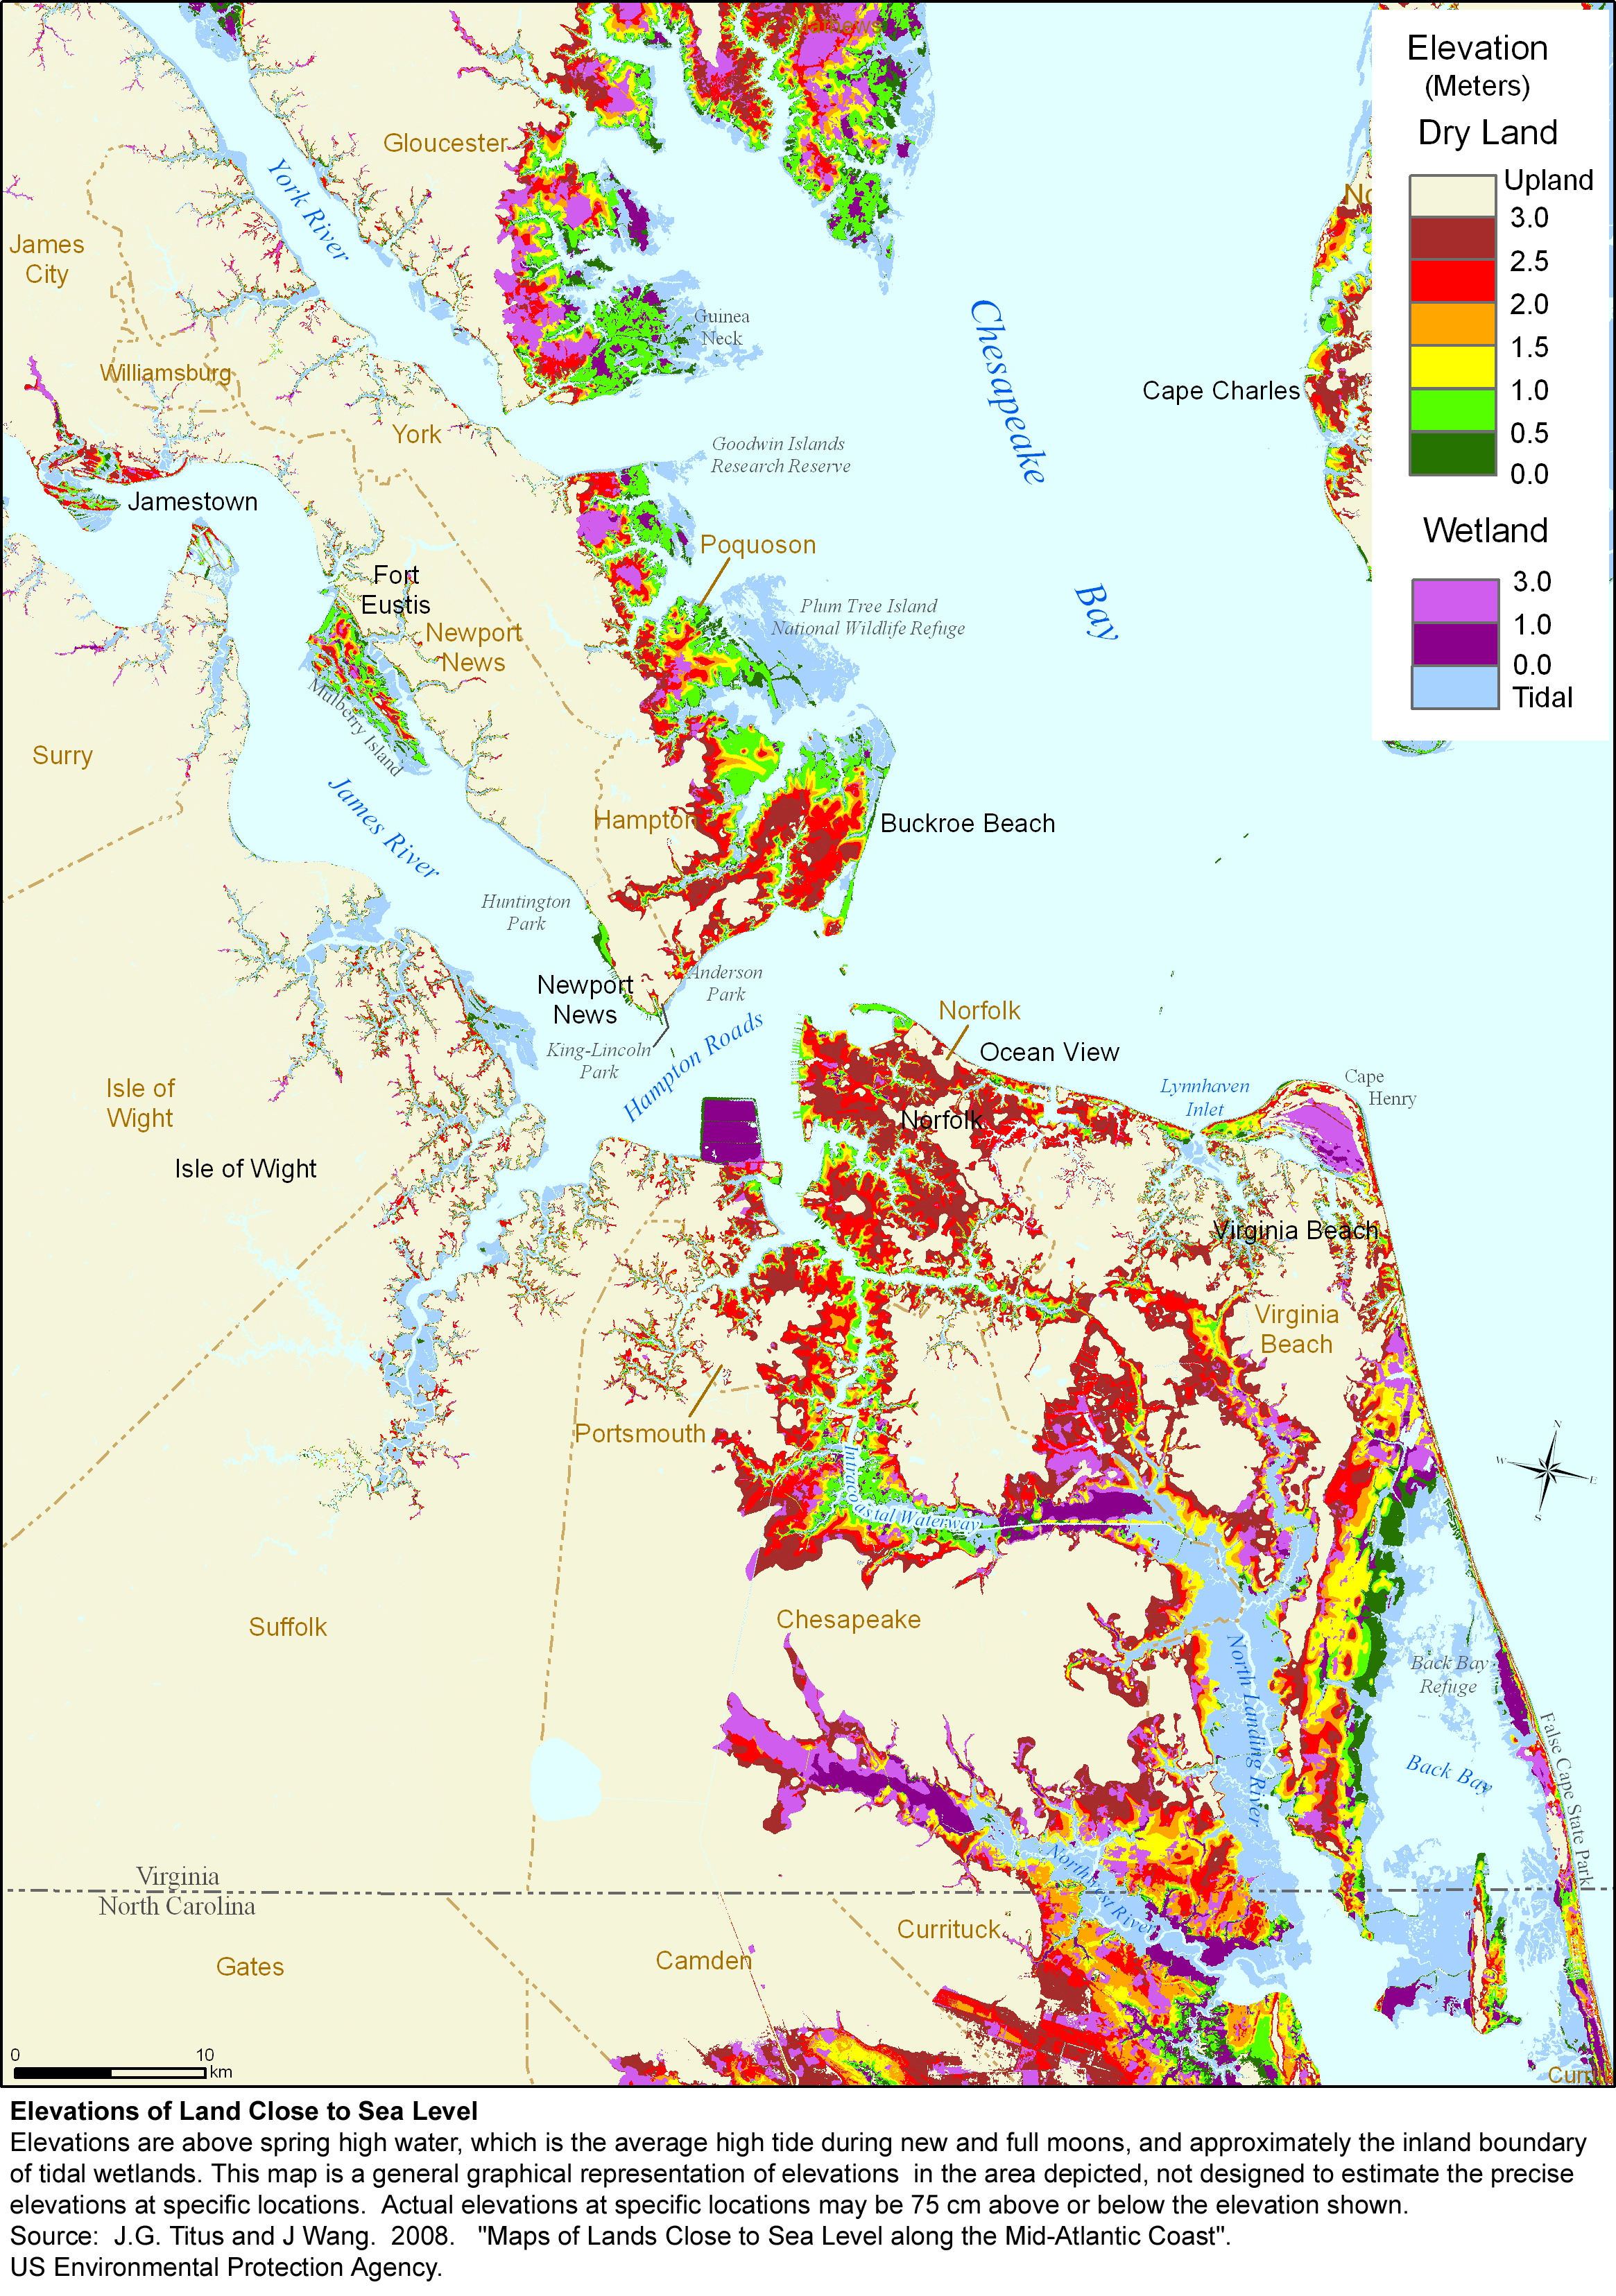
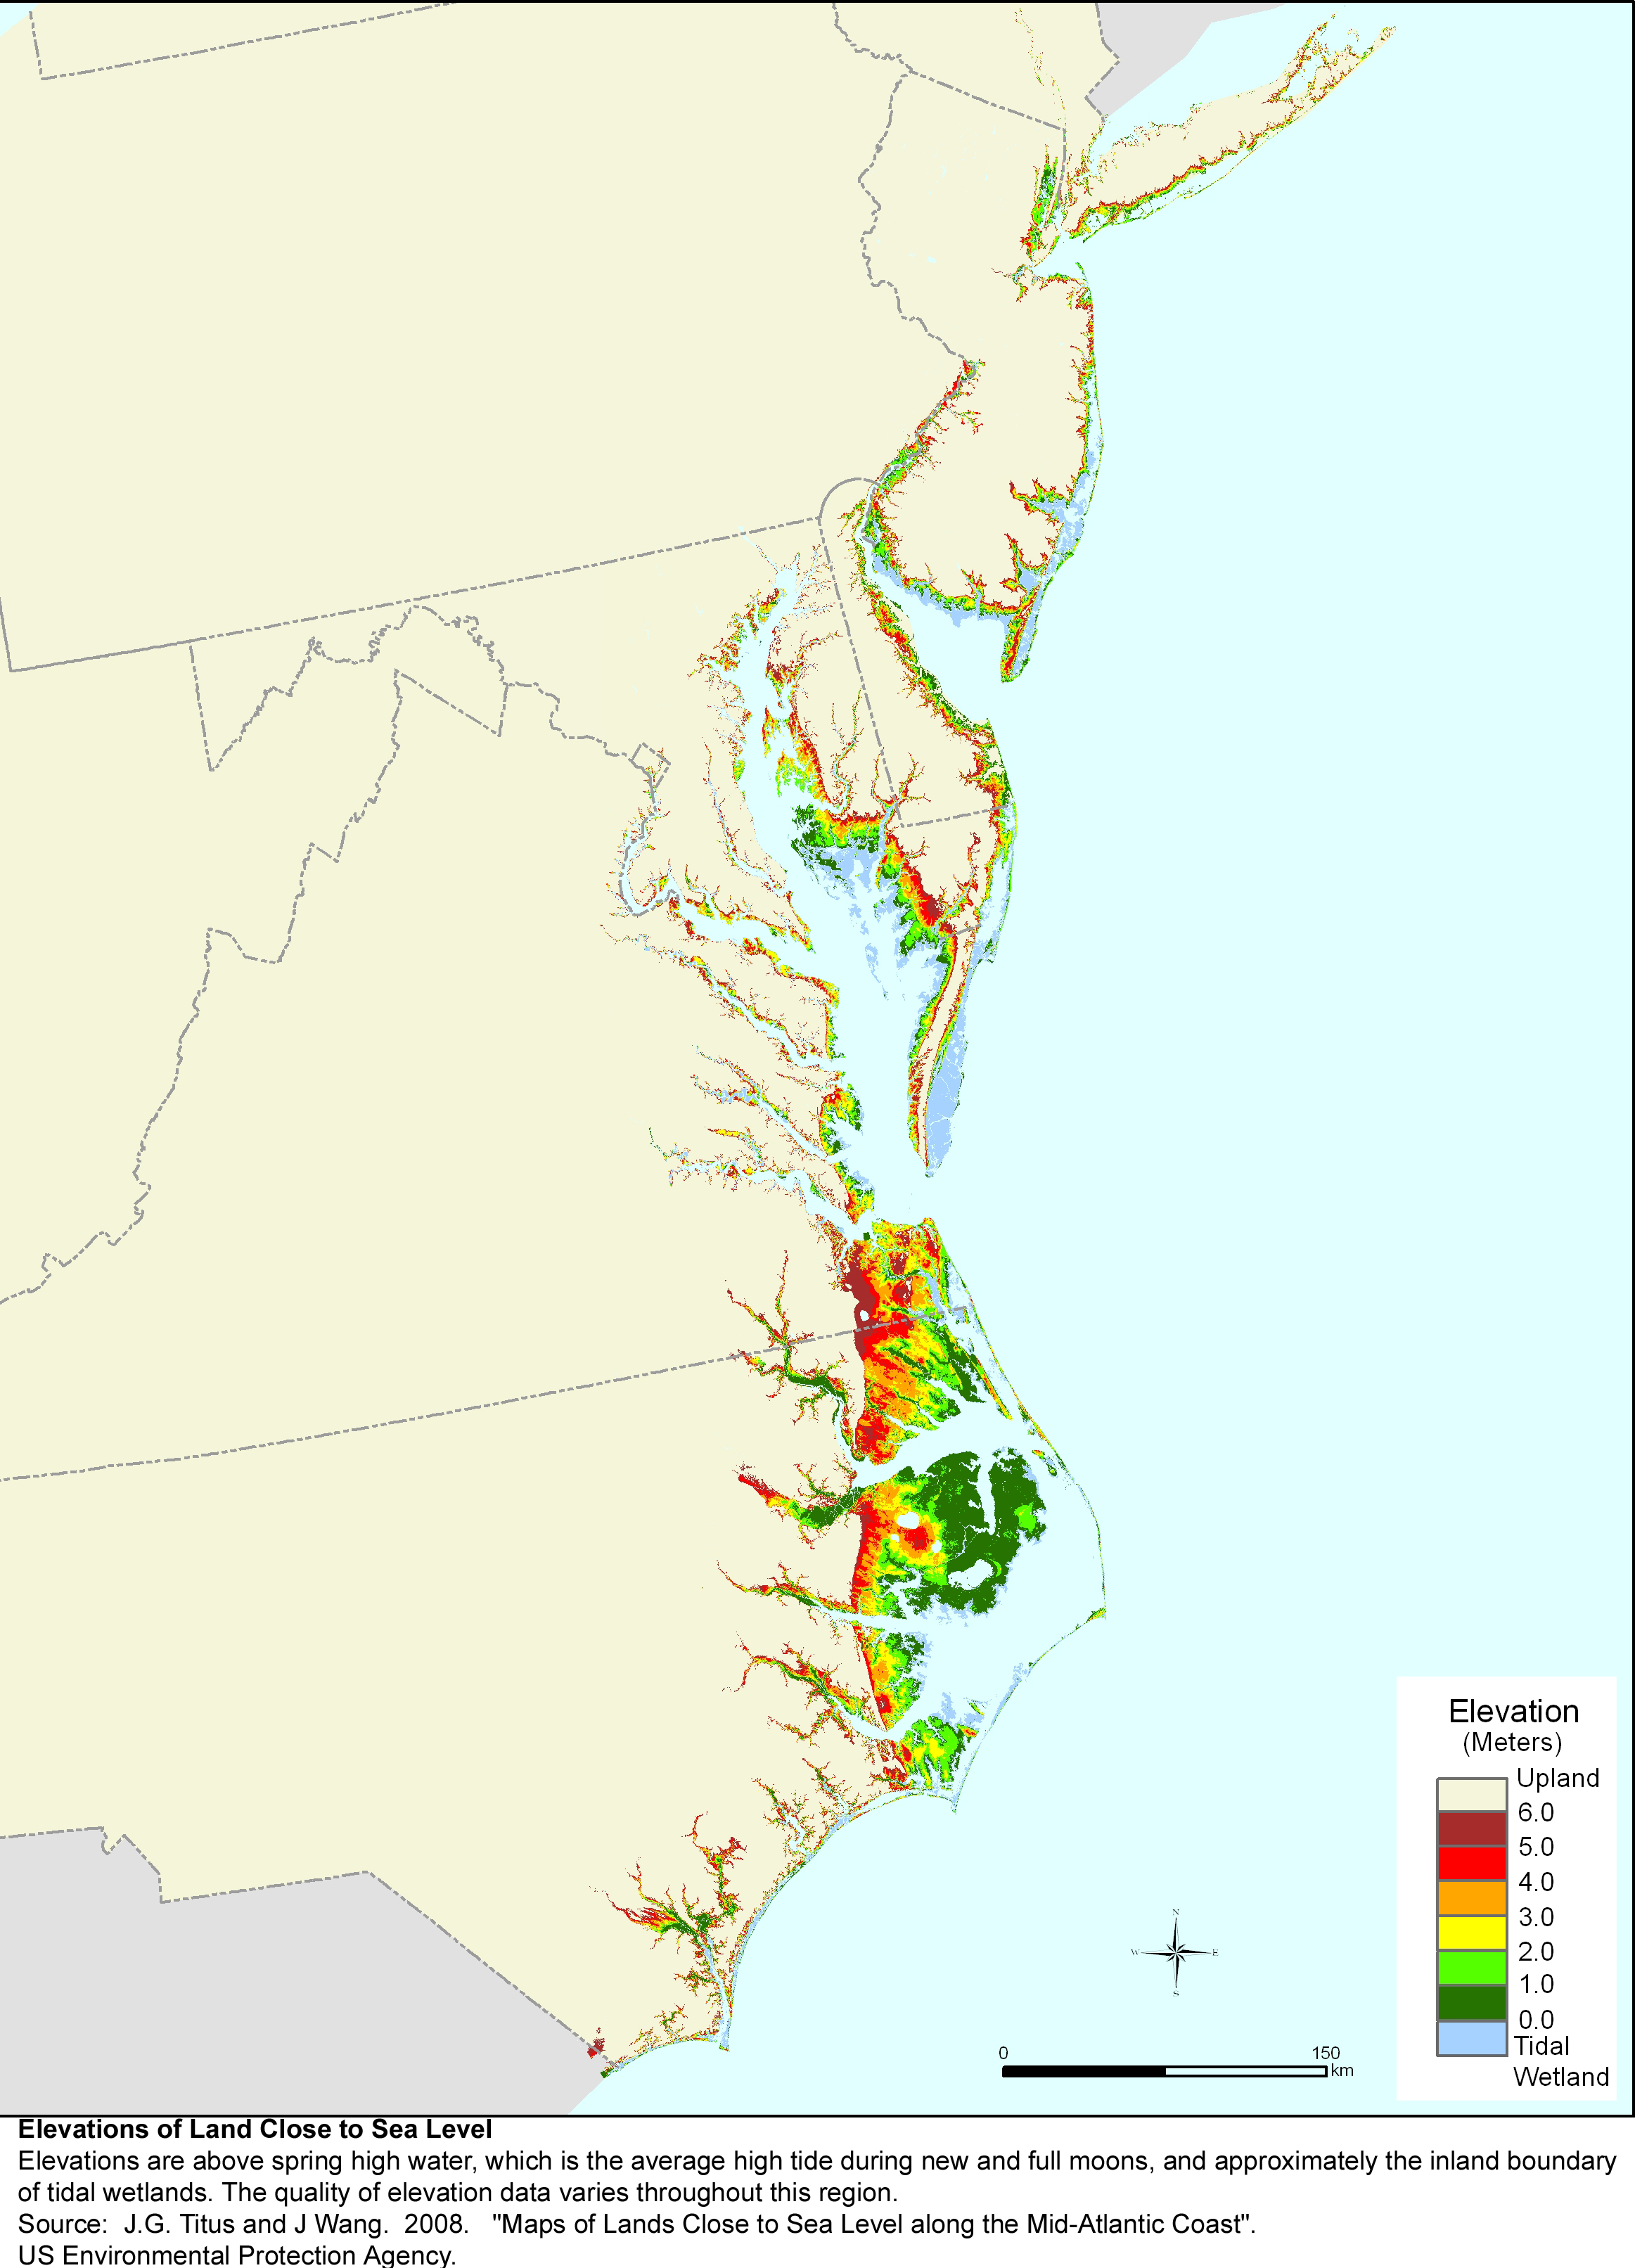
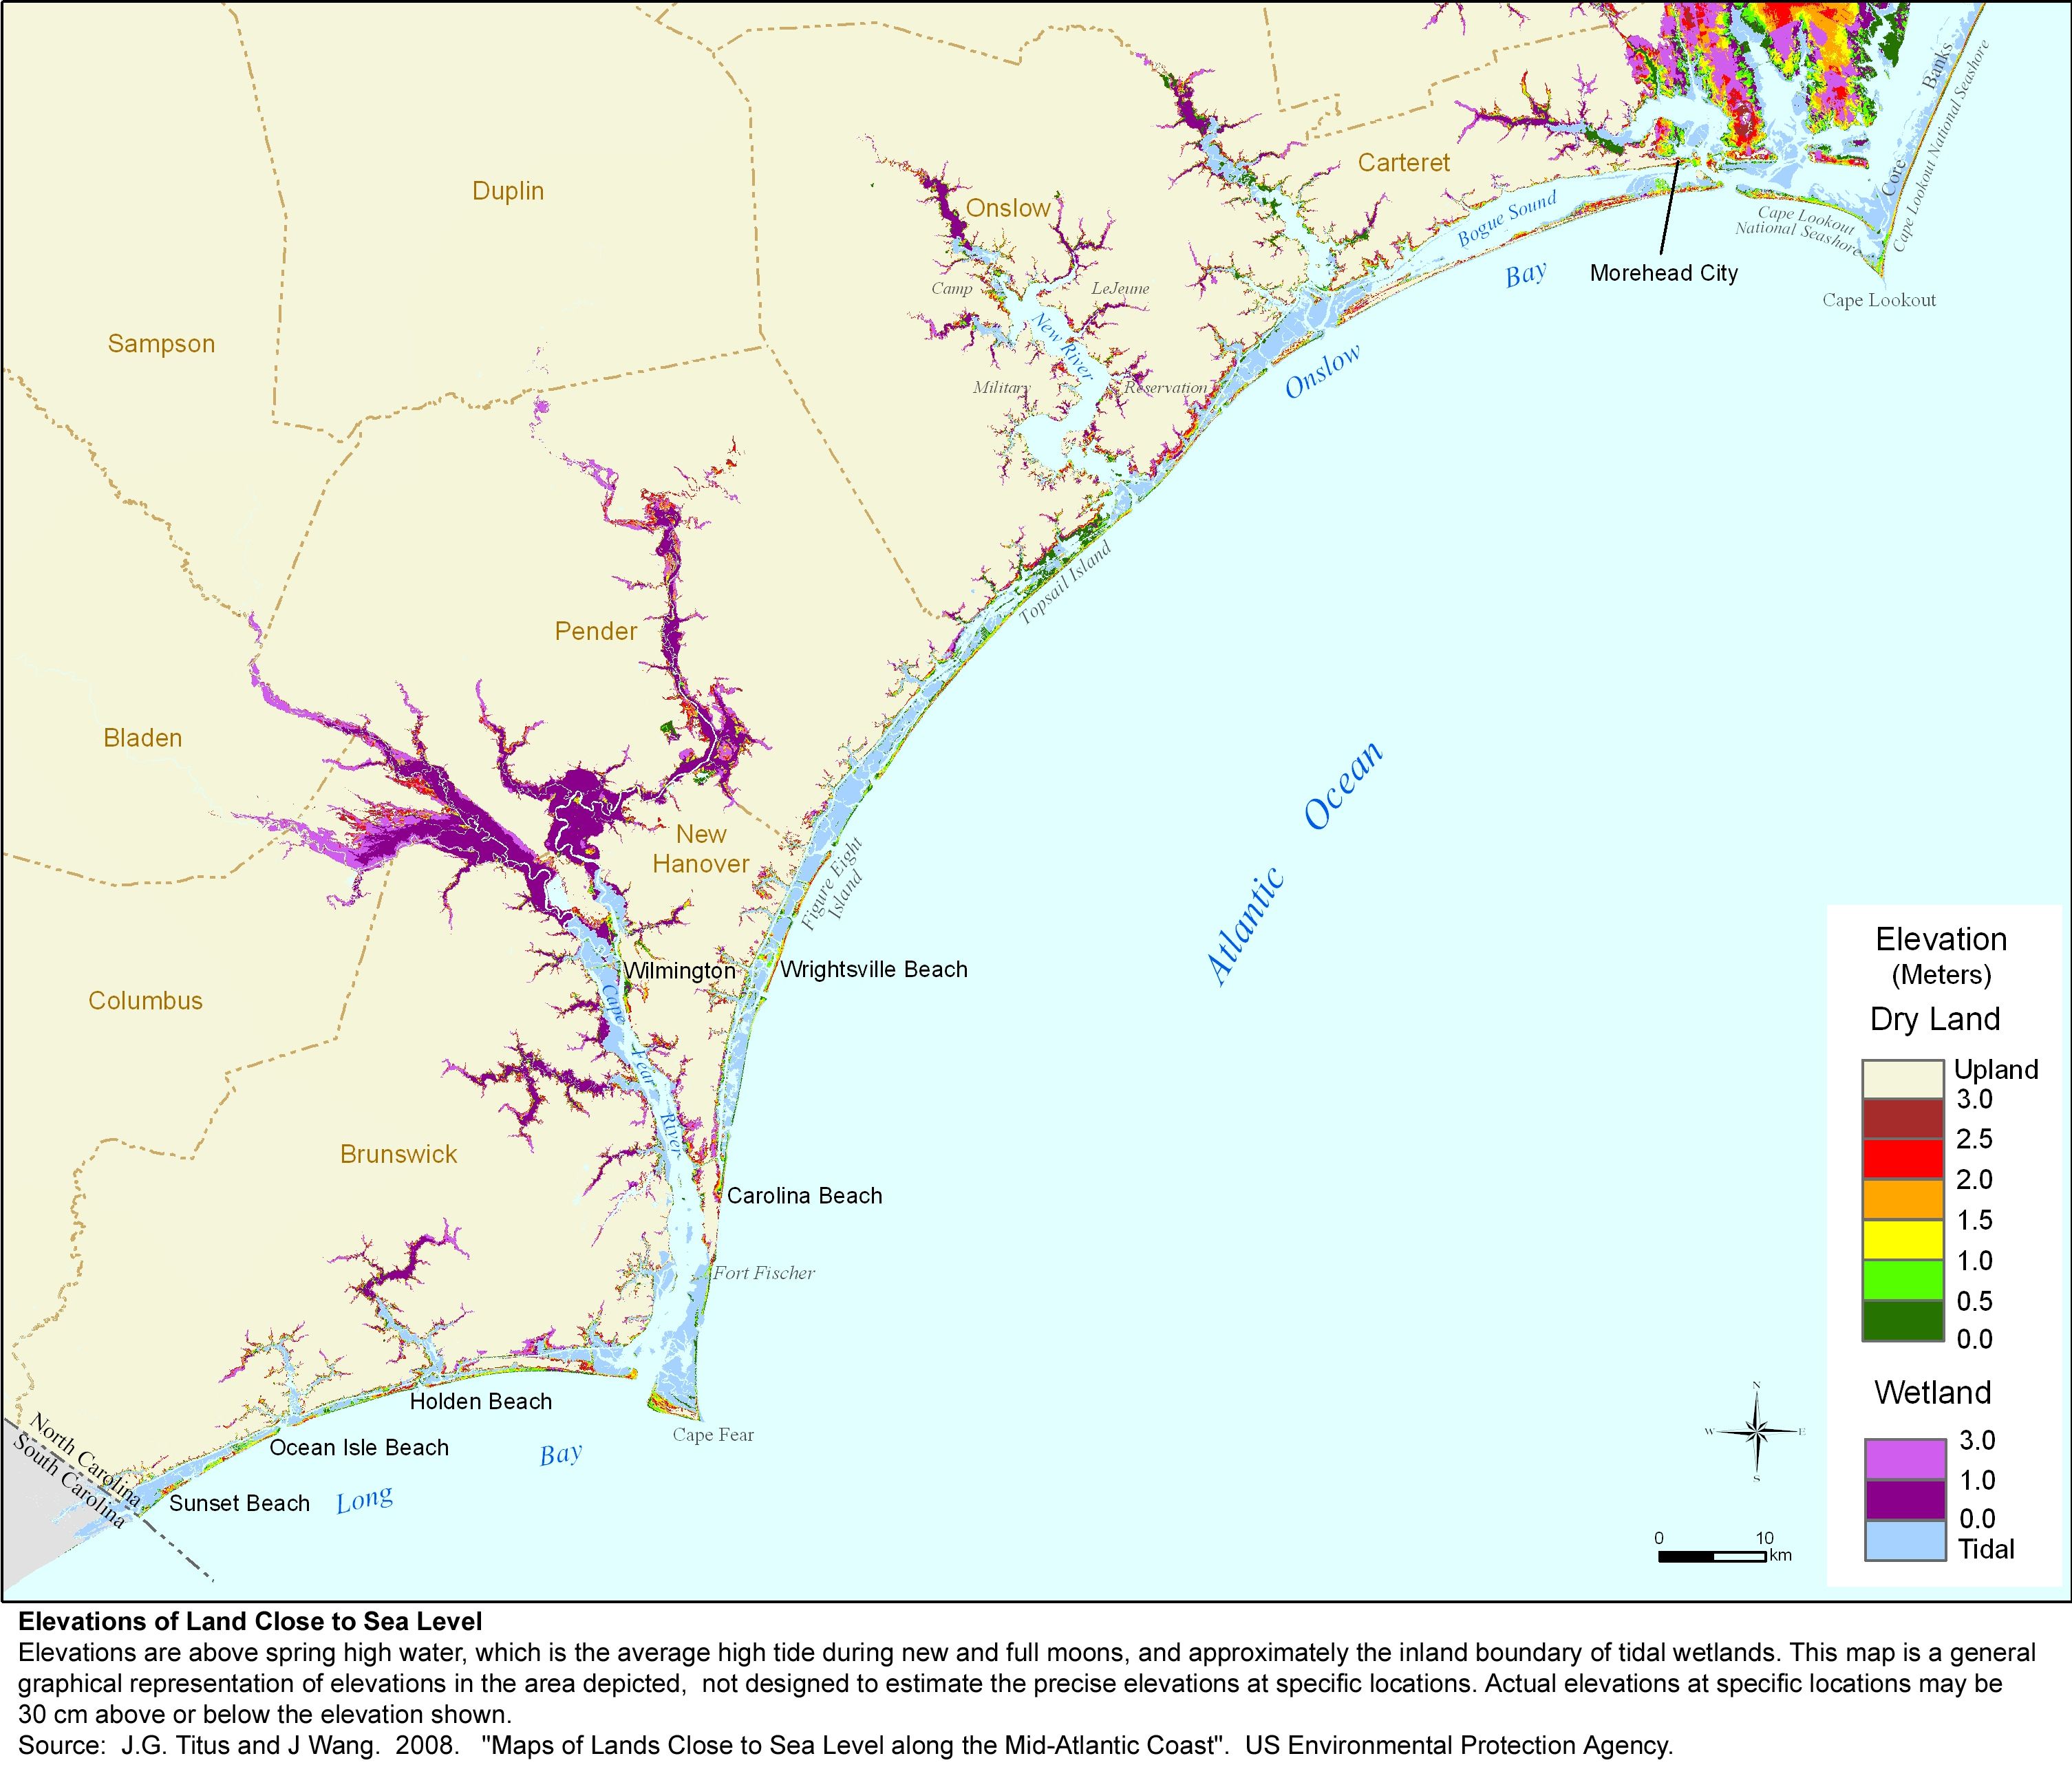
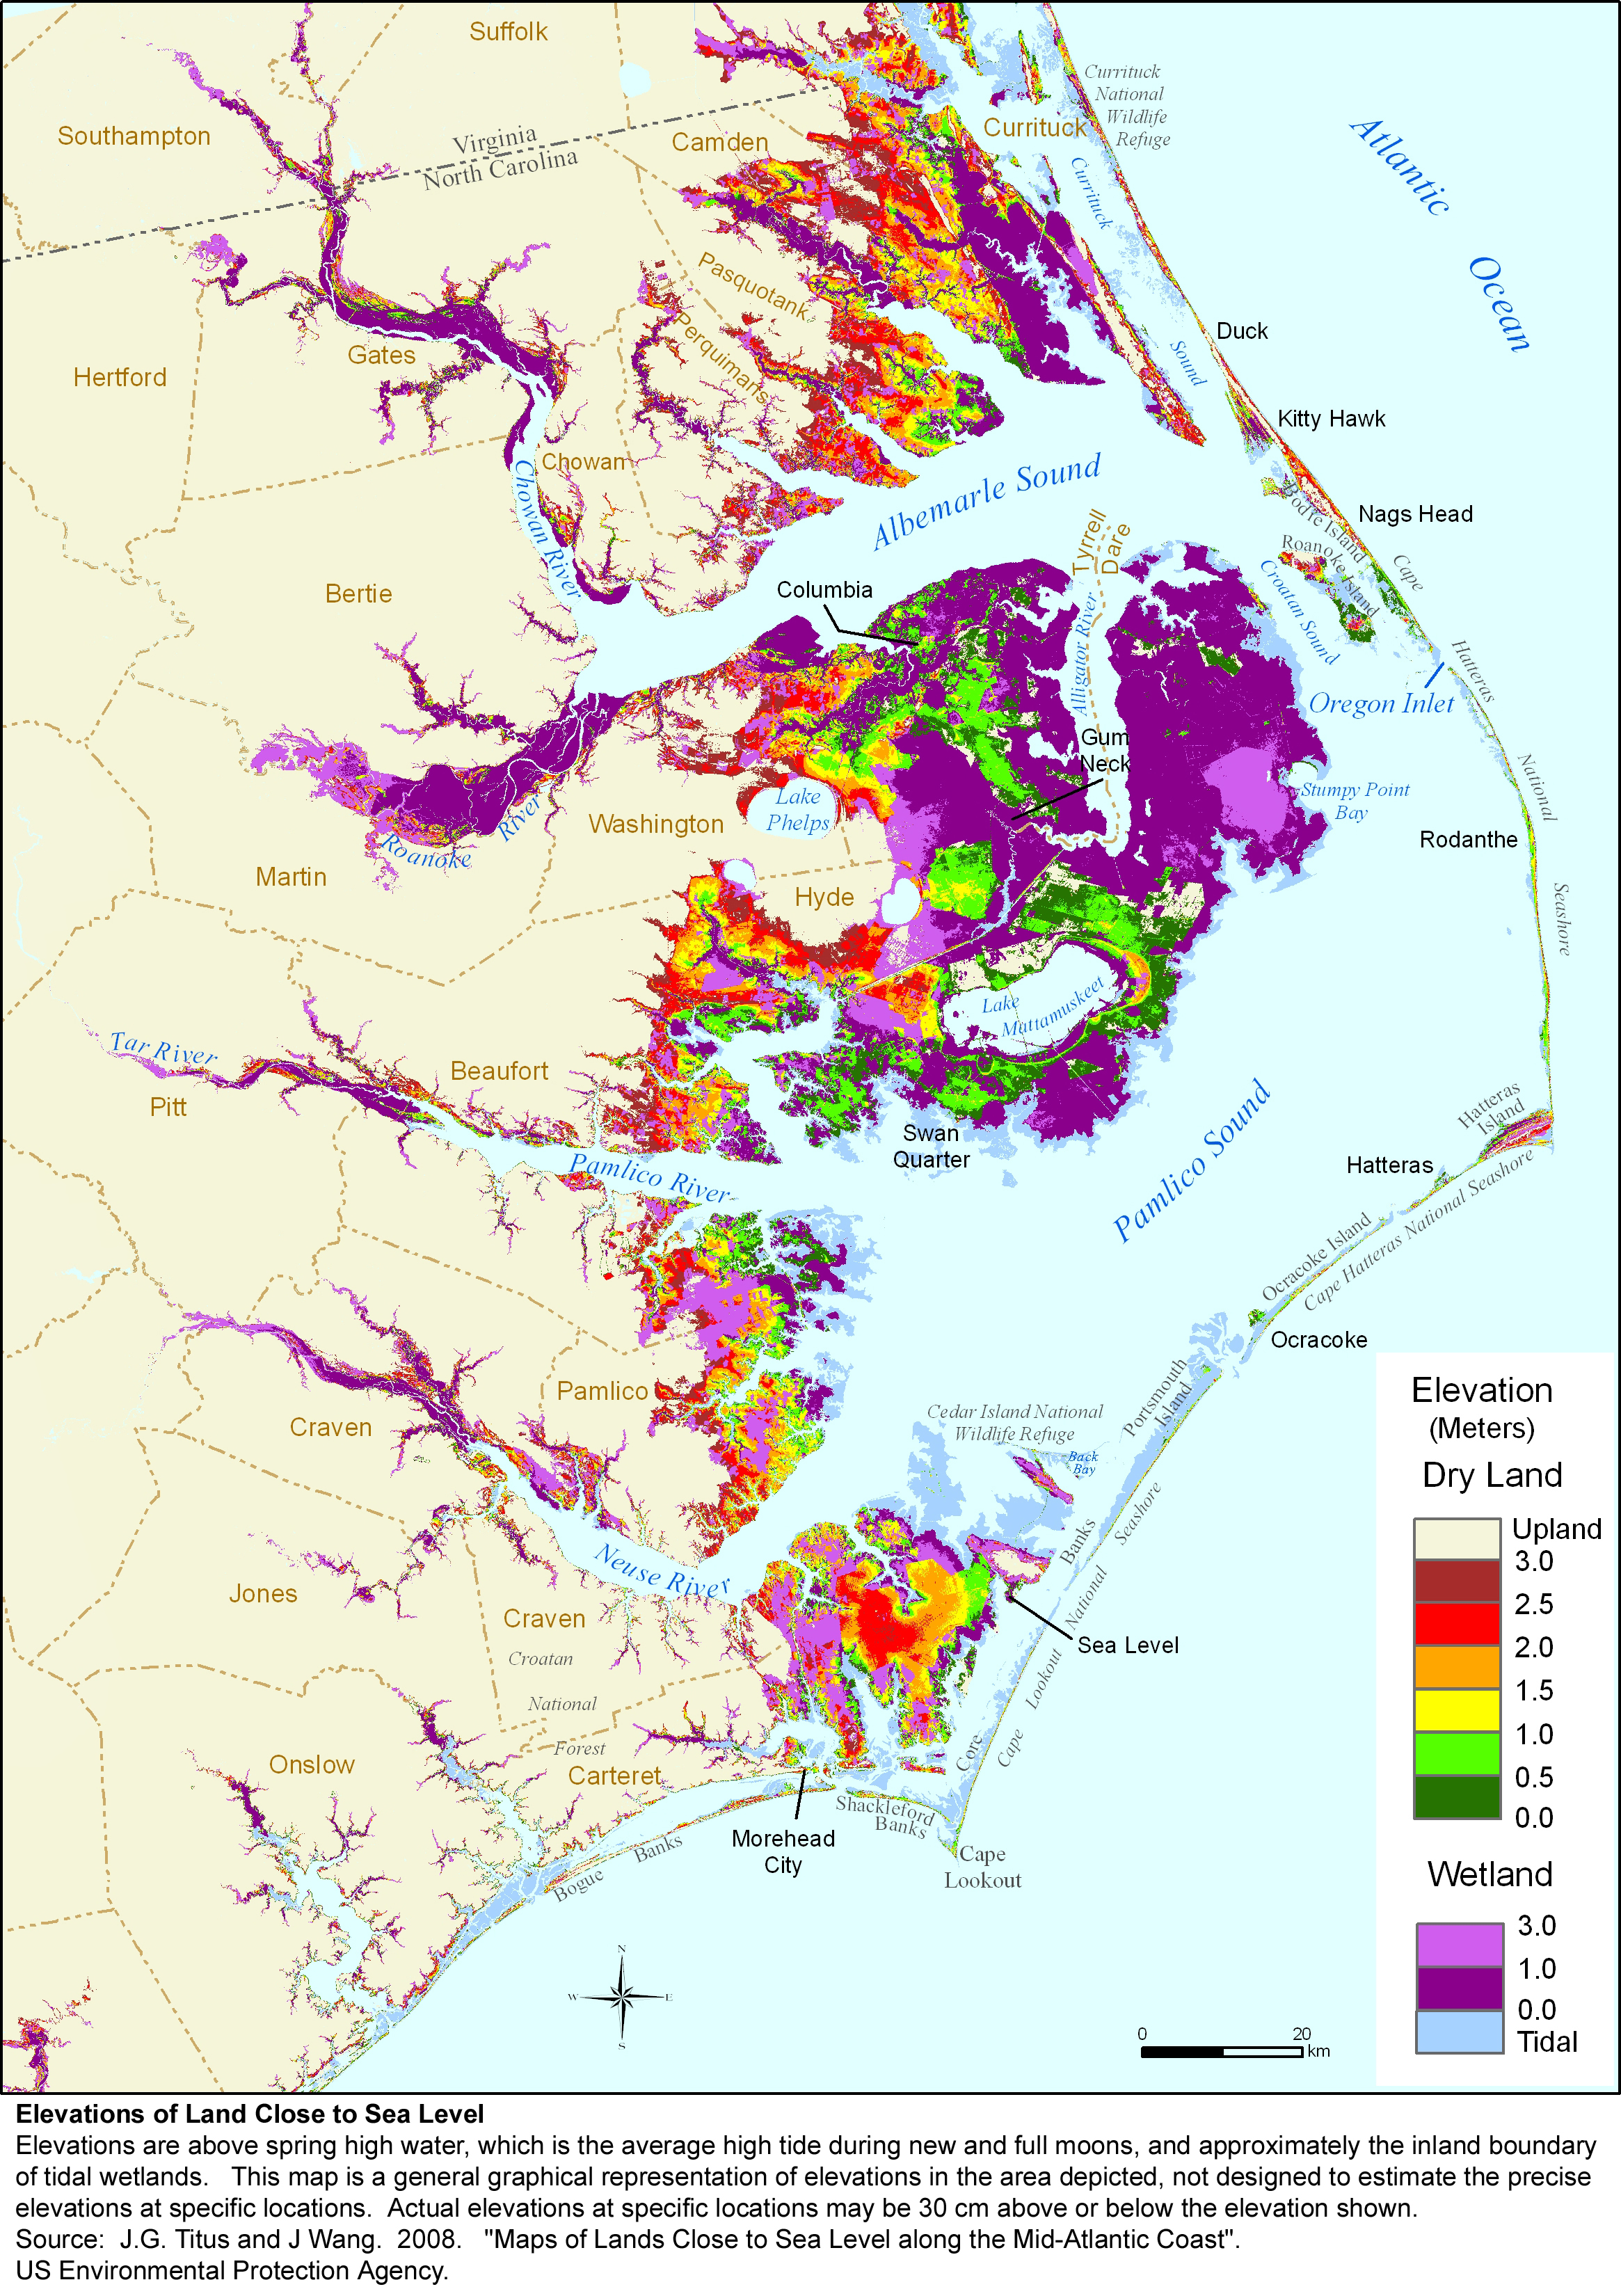
The potential for new wetland formation depends on the amount of low land immediately above the the ebb and flow of the tides ("topographic vulnerability"), and the extent to which that land would be available for wetland migration as sea level rises rather than become developed ("land use vulnerability"). Most of the maps on this page address the question of topographic vulnerability. Figures 2 and 3 shows the ratio of the area of tidal wetlands to the land available for wetland migration (assuming no shore protection). The ratios are calculated by county. The only difference is that Figure 2 uses the dry land within one-half the spring tide range above the tidal wetlands, while Figure 3 uses the land within one full tide range. For example, if the tide range is one meter, then Figure 2 looks at the area of land within 50 cm above the tidal wetlands. These Figures essentially provide the ratio of the average slopes of the land over the dry land to the slope over the tidal wetlands. If we ignore wetland migration, the provide an estimate of the loss of wetlands from a rapid rise in sea level. If the ratio is 10, for example, then for every square kilometer of wetlands lost, one-tenth of a square kilometer of dry land would be submerged. So in equilibrium there would be a 90% net loss of wetlands.
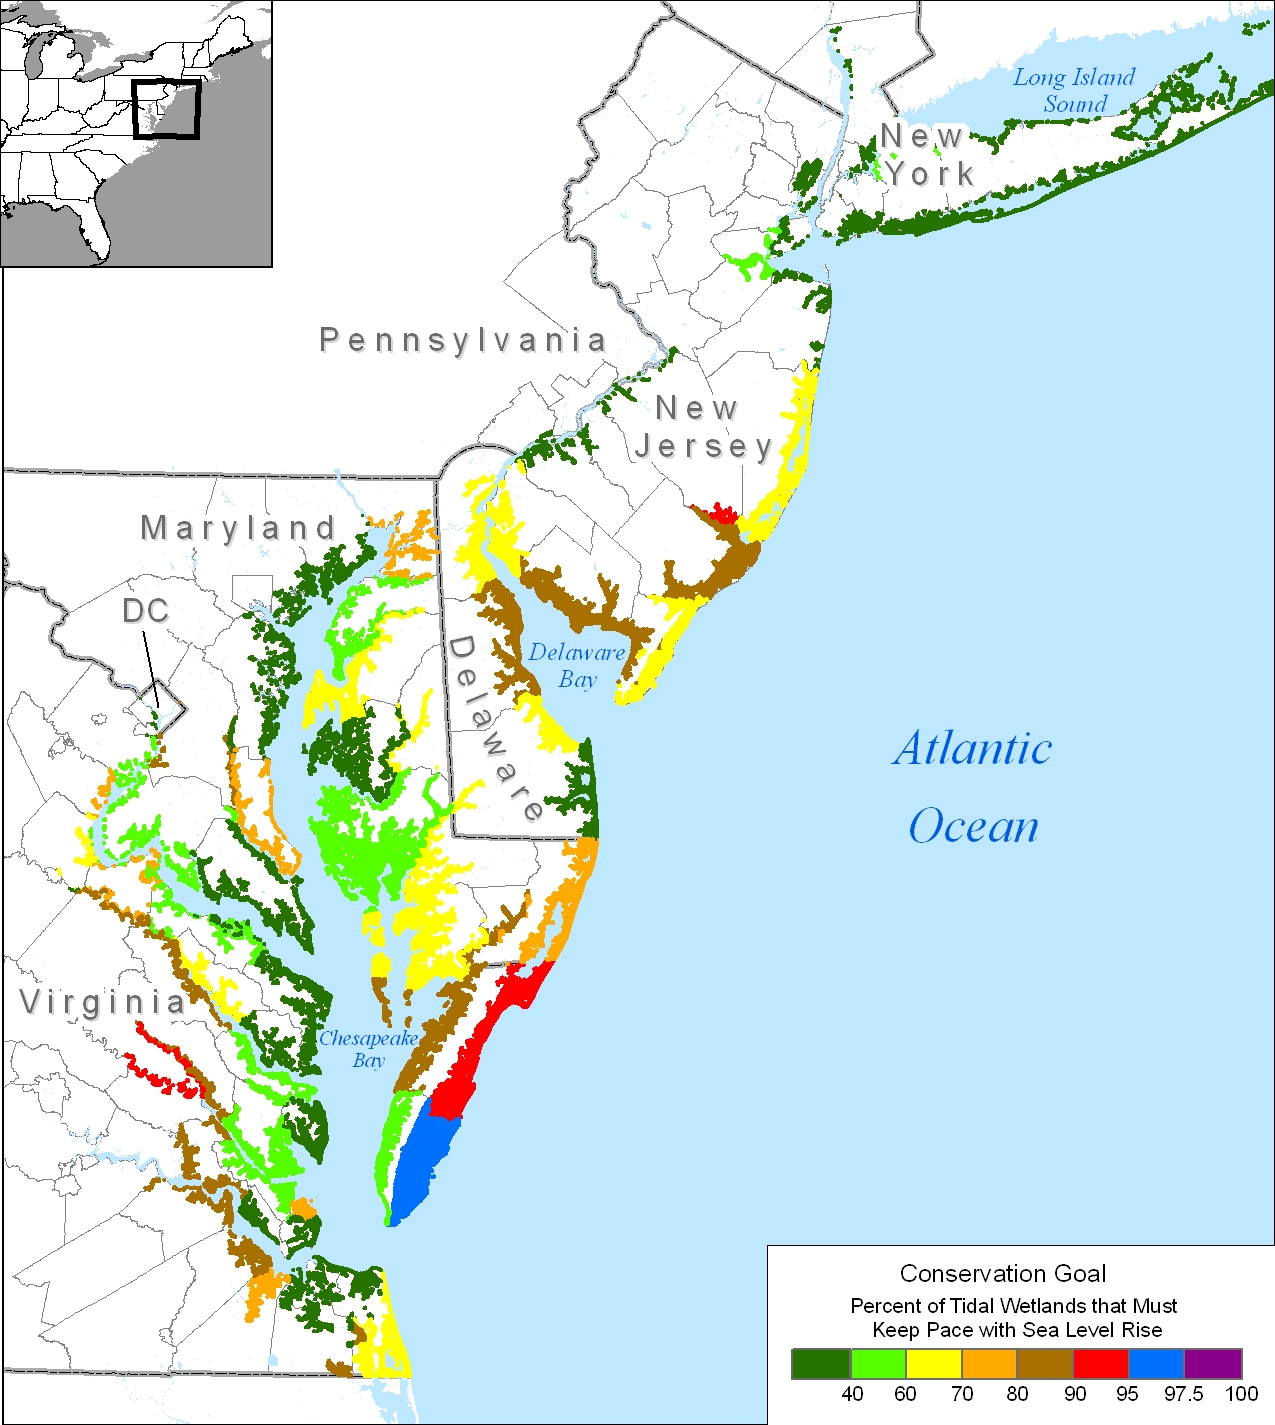
Figure 4 indirectly considers wetland accretion, by calculating the fraction of tidal wetlands that must keep pace with rising sea level for sea level rise to cause no net loss, that is, for the loss of existing wetlands to be no greater than the new dry land that becomes submerged (assuming no shore protection.
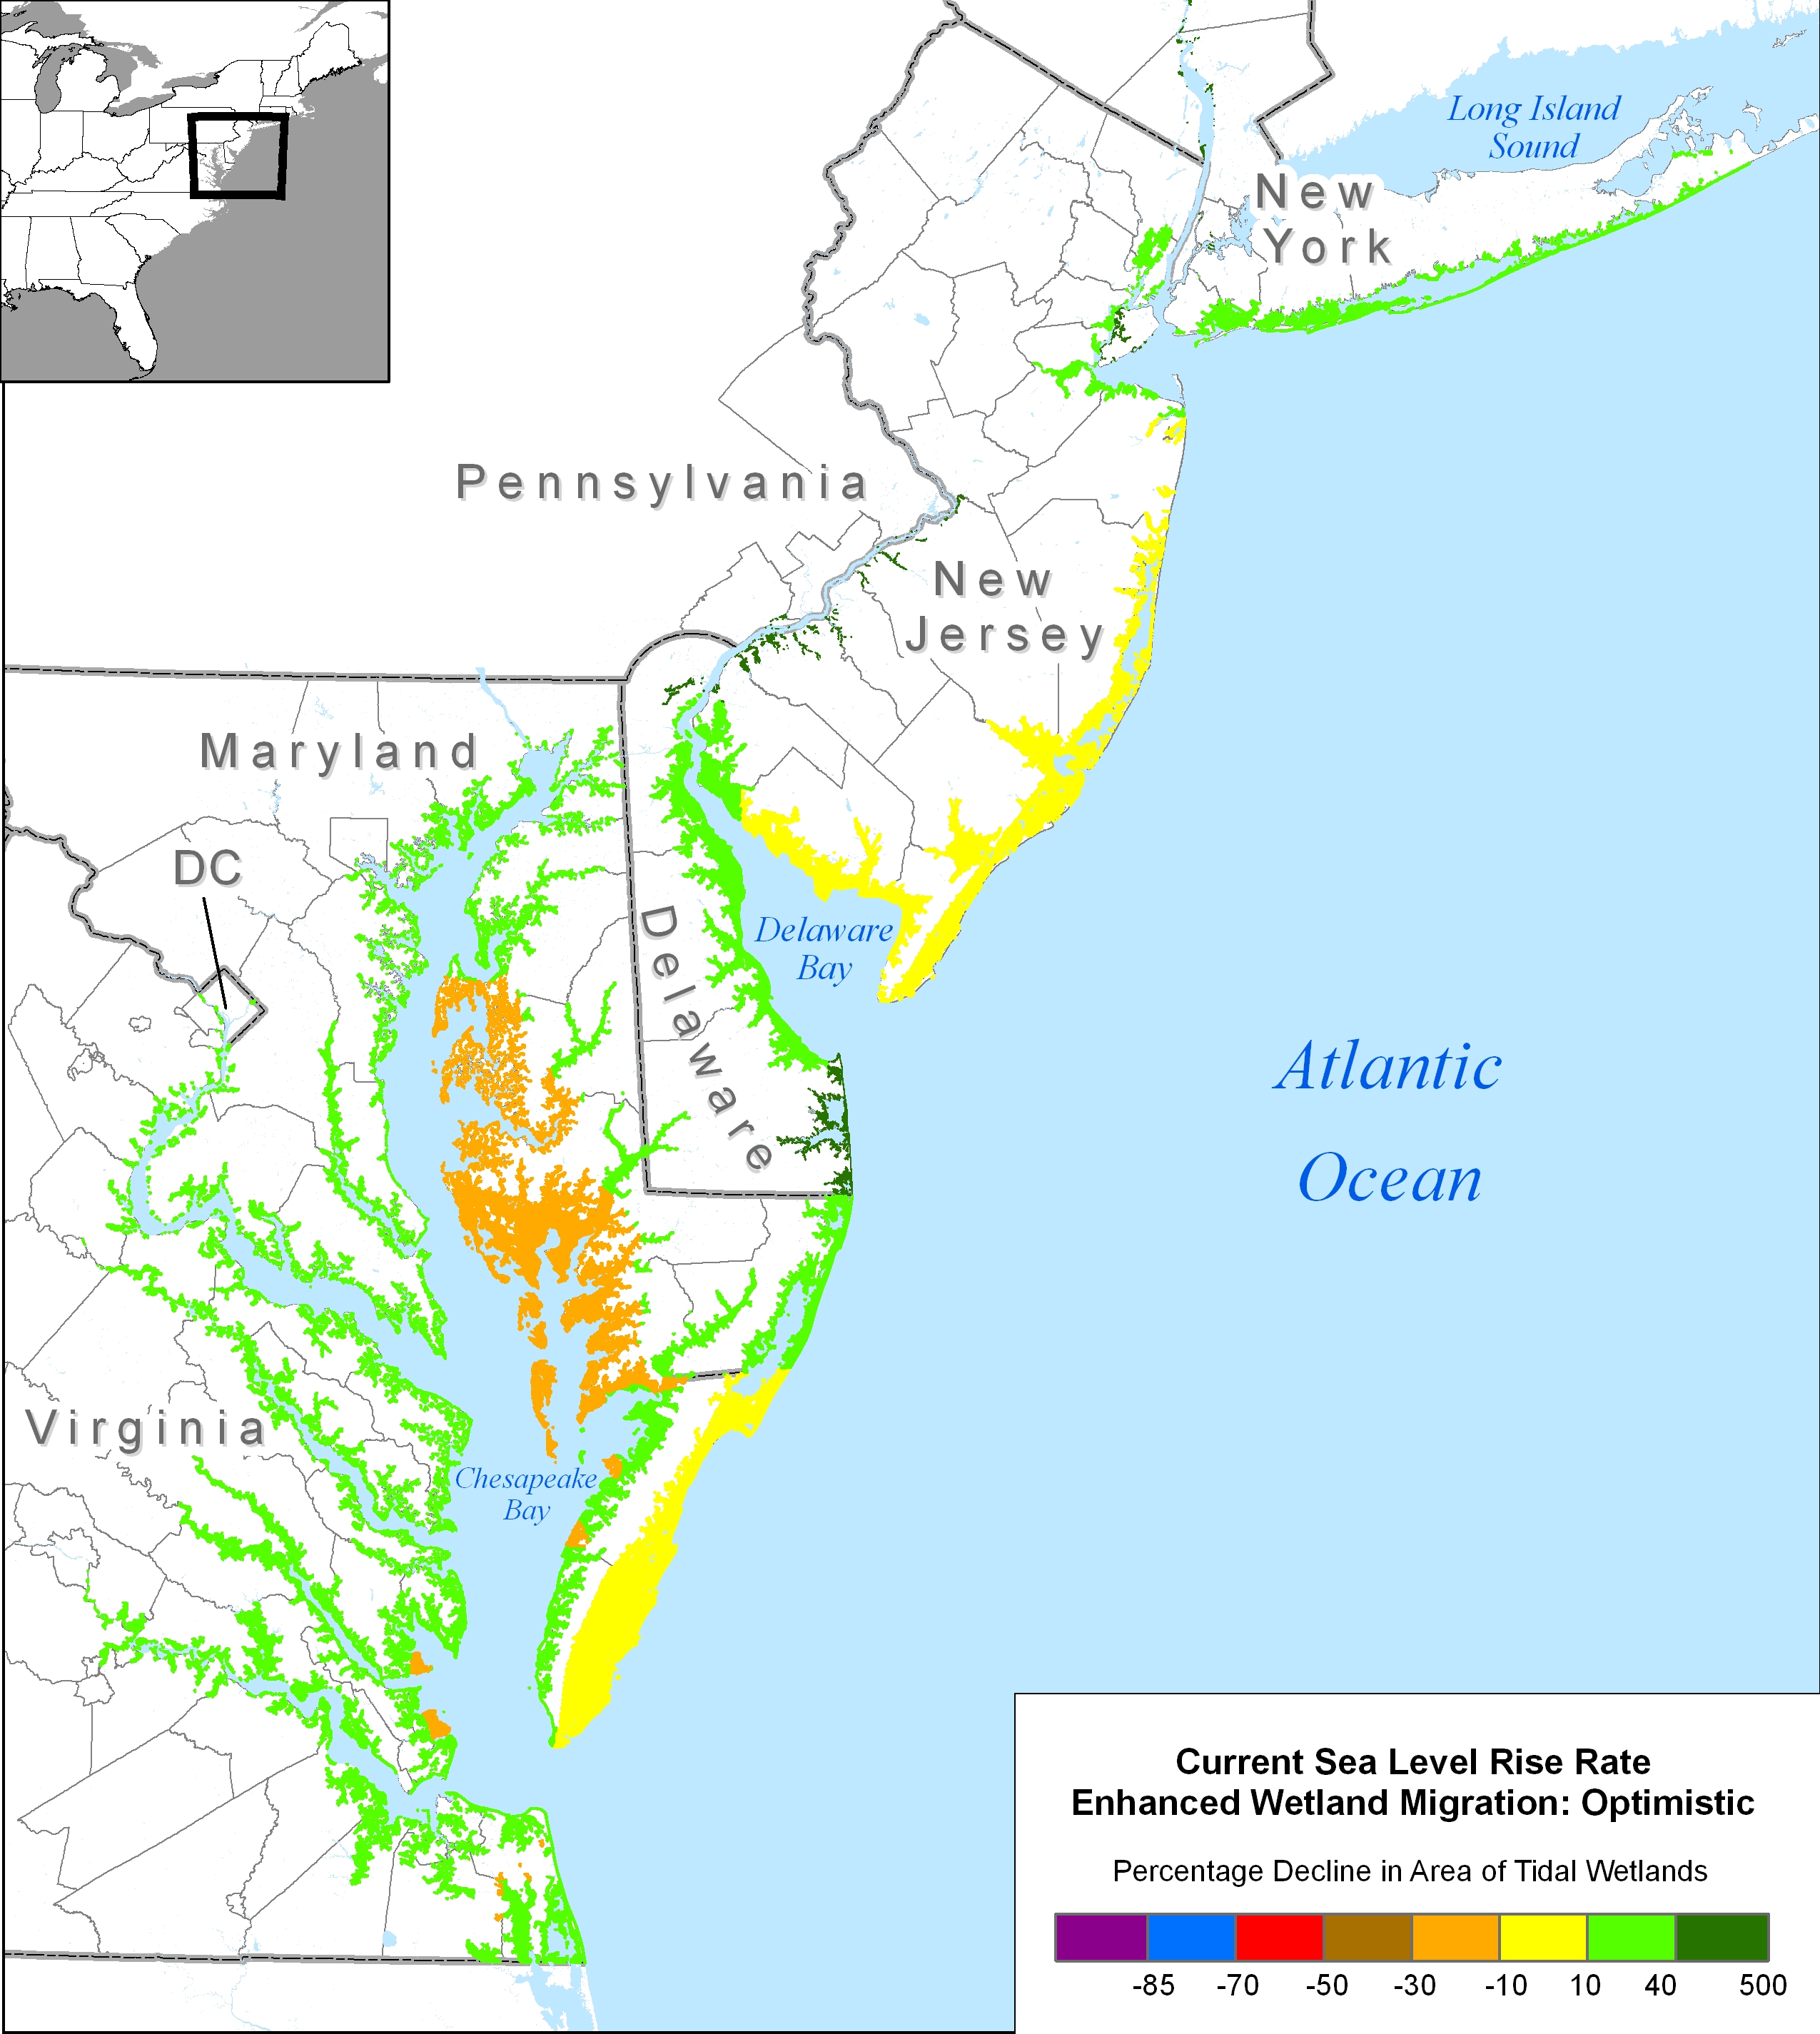
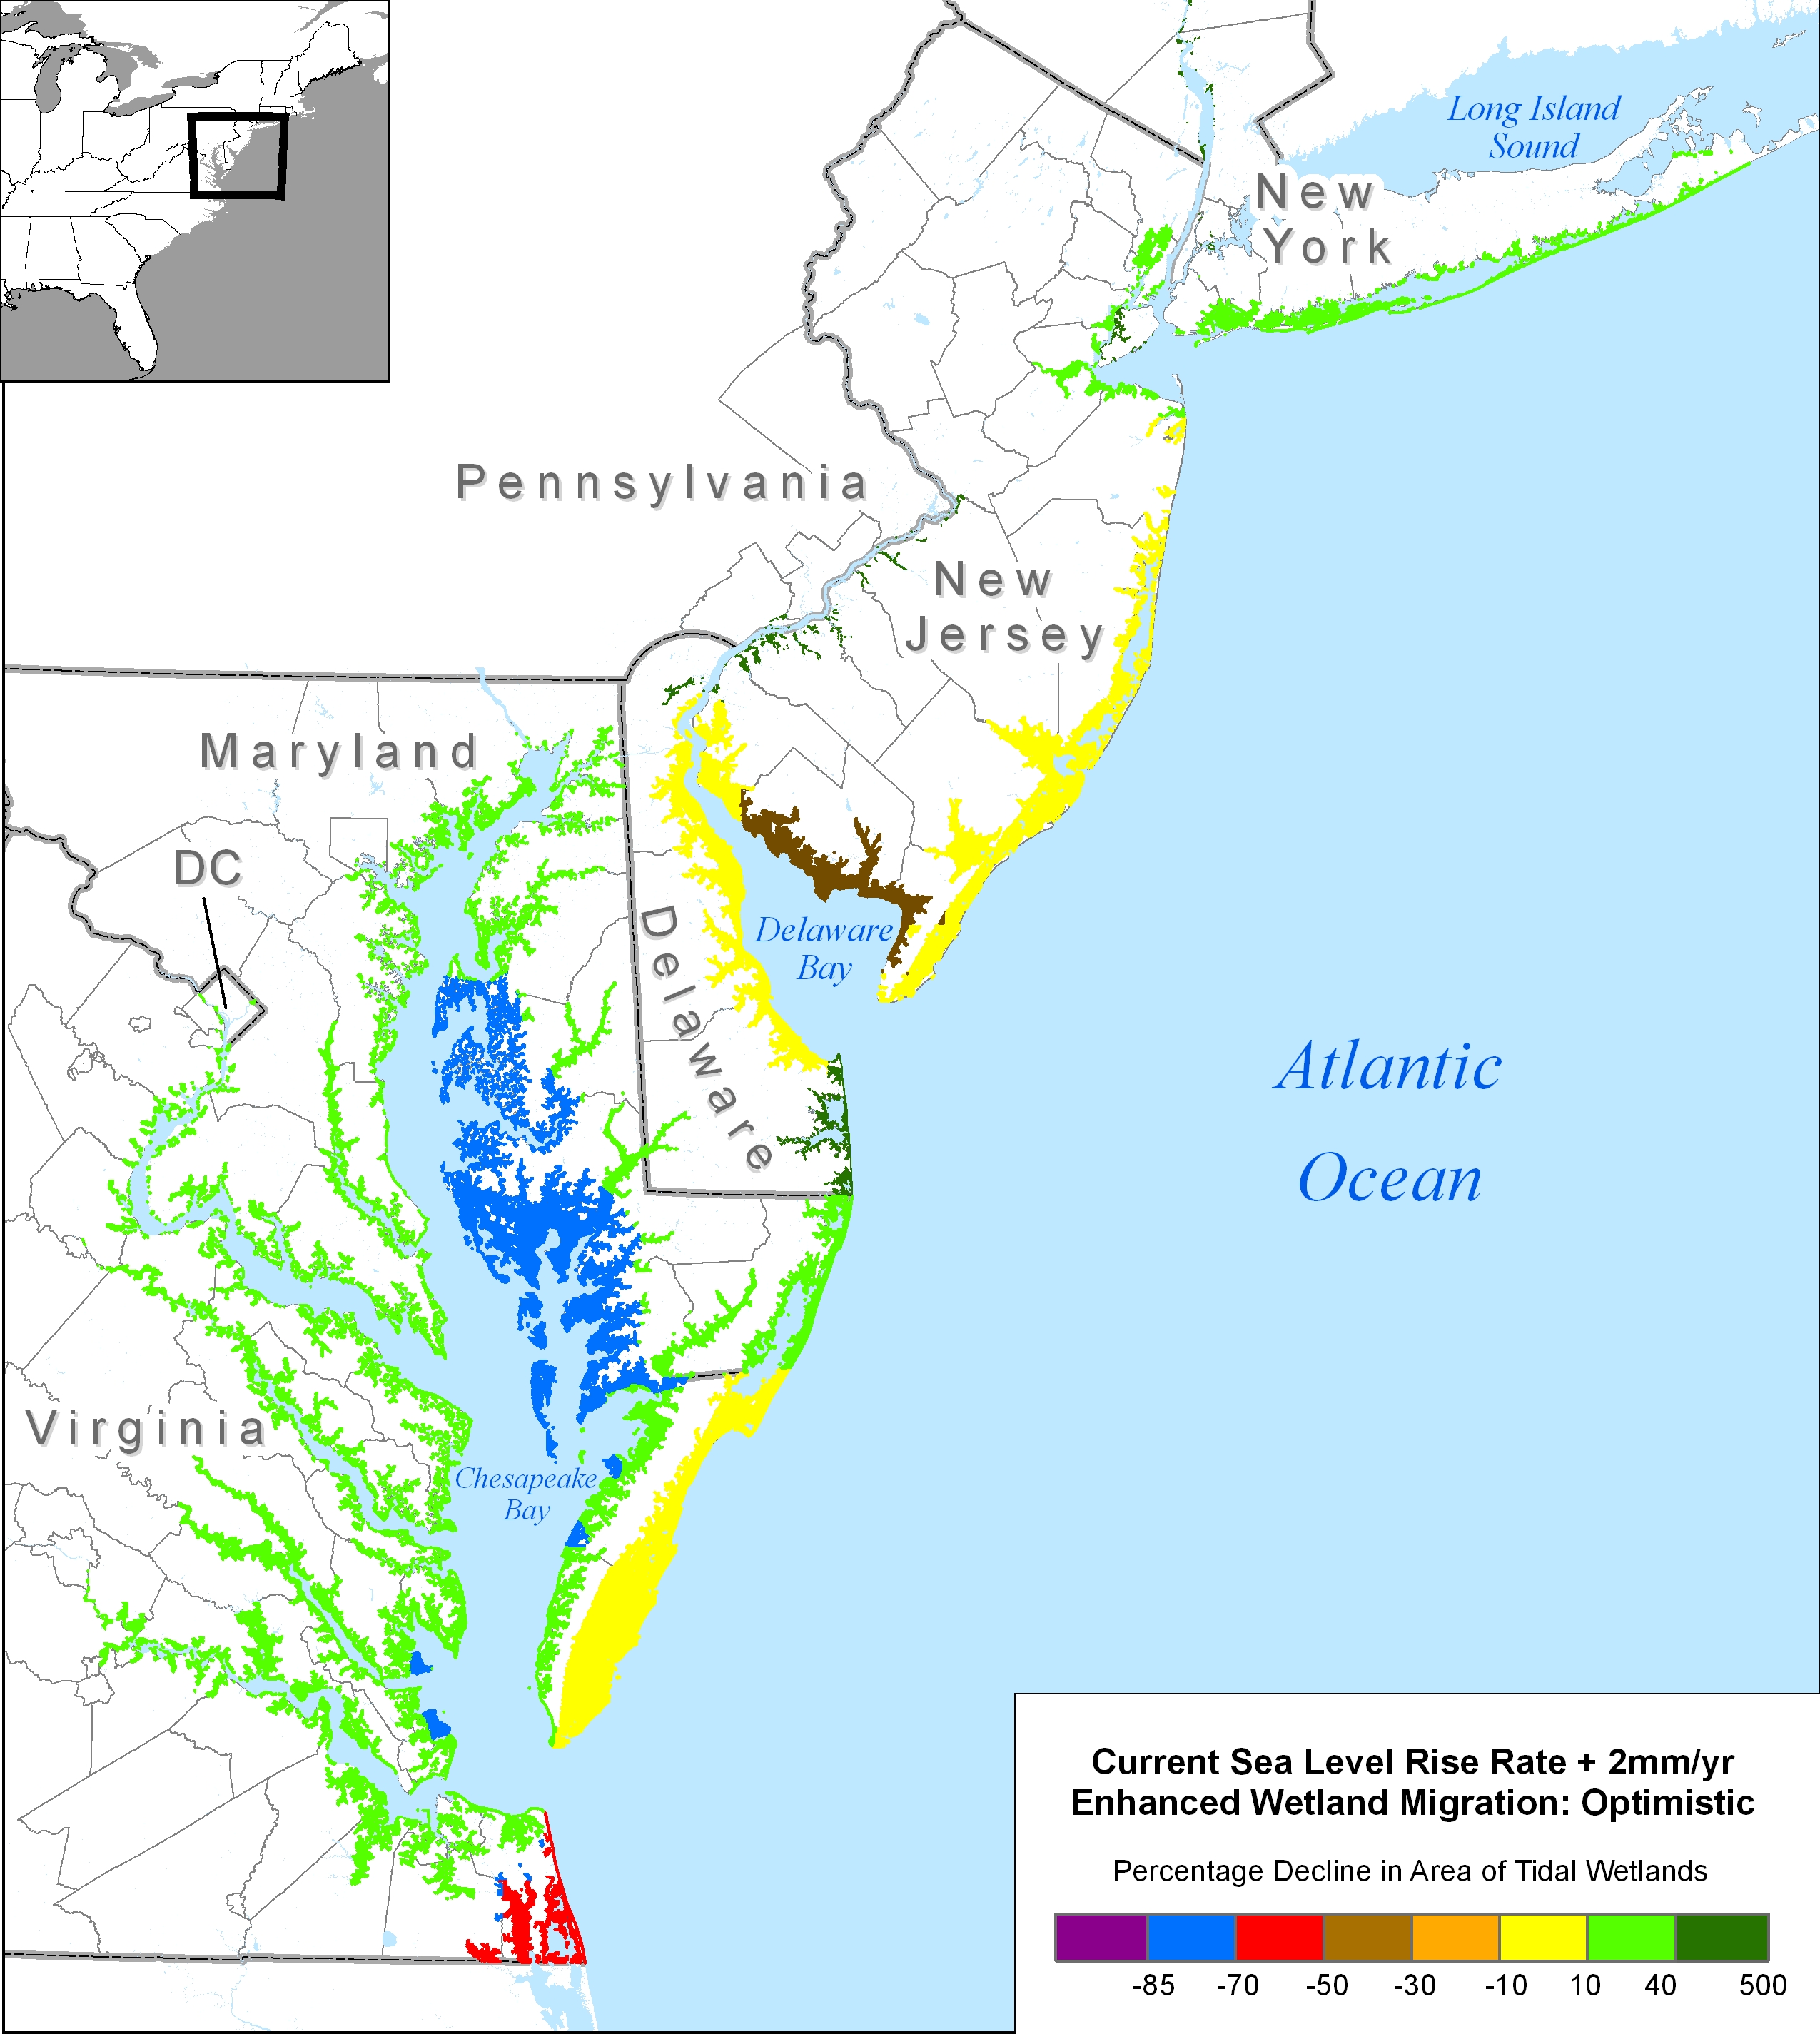
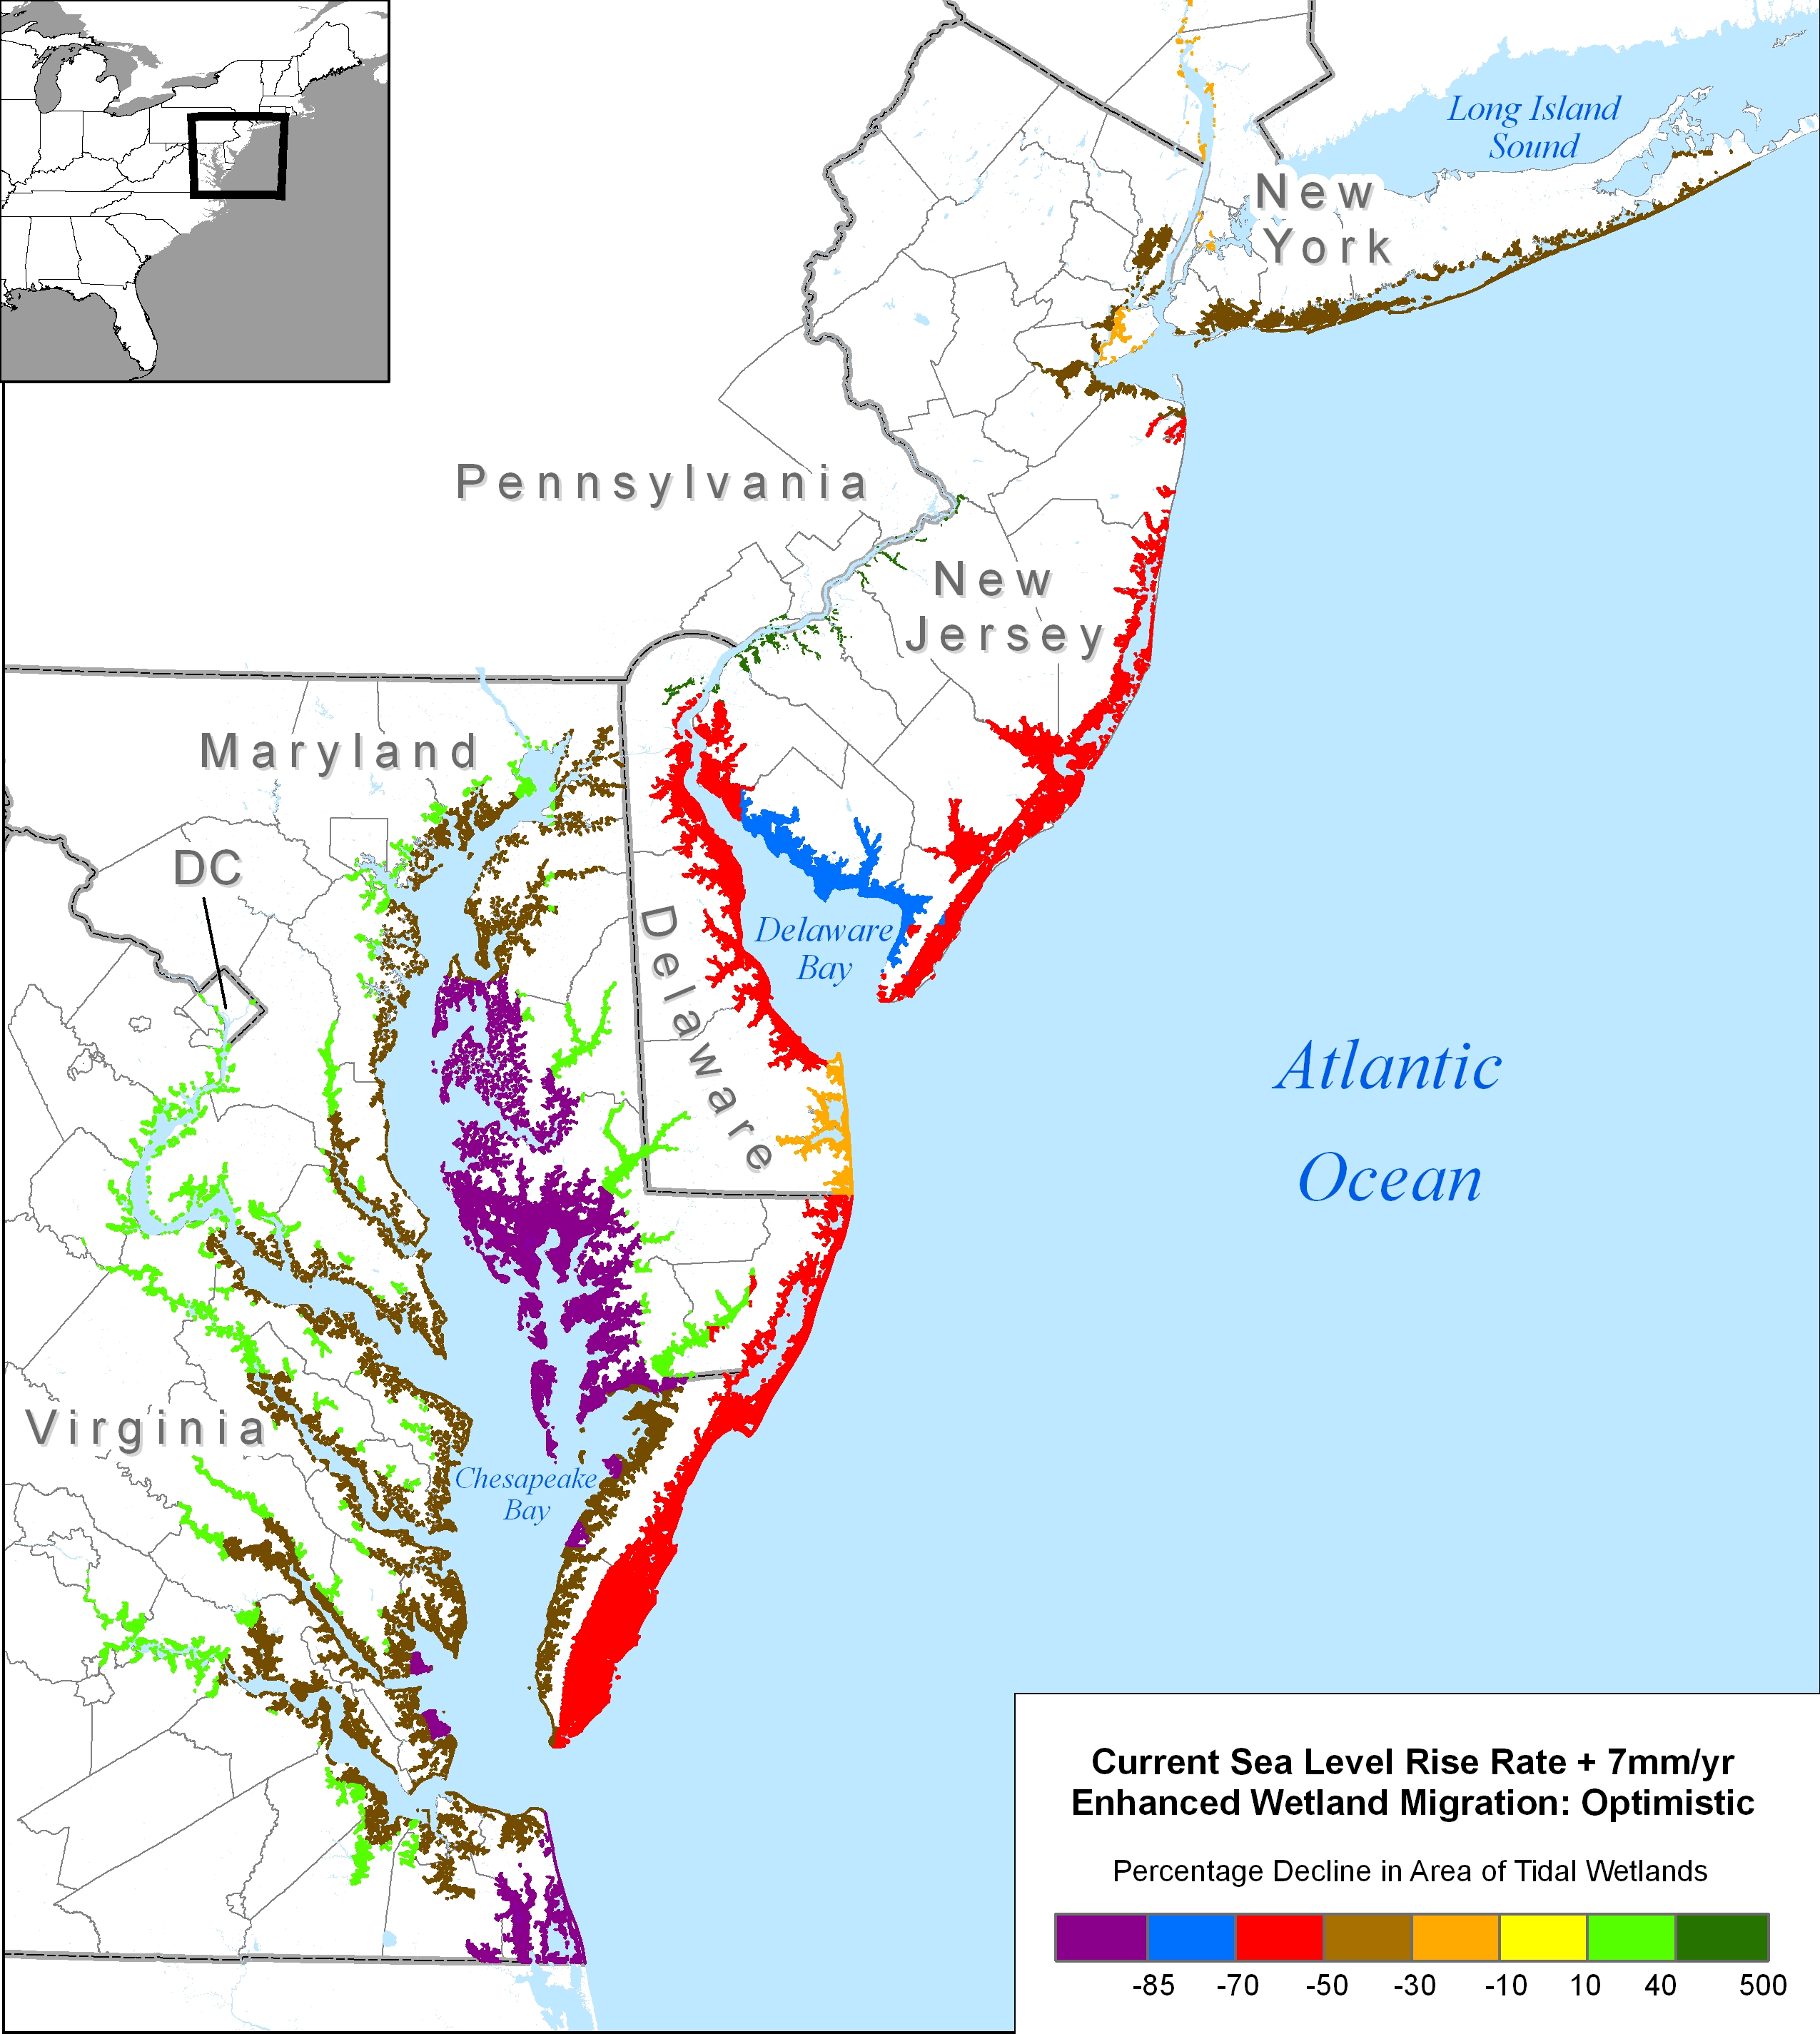
Finally, Figures 5-7 combine the wetland accretion from Figure 1 with the topography from Figures 2 and 3, to calculate net wetland loss--assuming no shore protection. Wherever Figure 1 assumes "marginal", these figures assume that wetlands can keep pace with sea level rise. Logically, we should also have a companion set that assumes that the marginal wetlands are lost. Those maps, however are not yet available so we provide what we have.
|
|
|
||
|
|
|
|
|