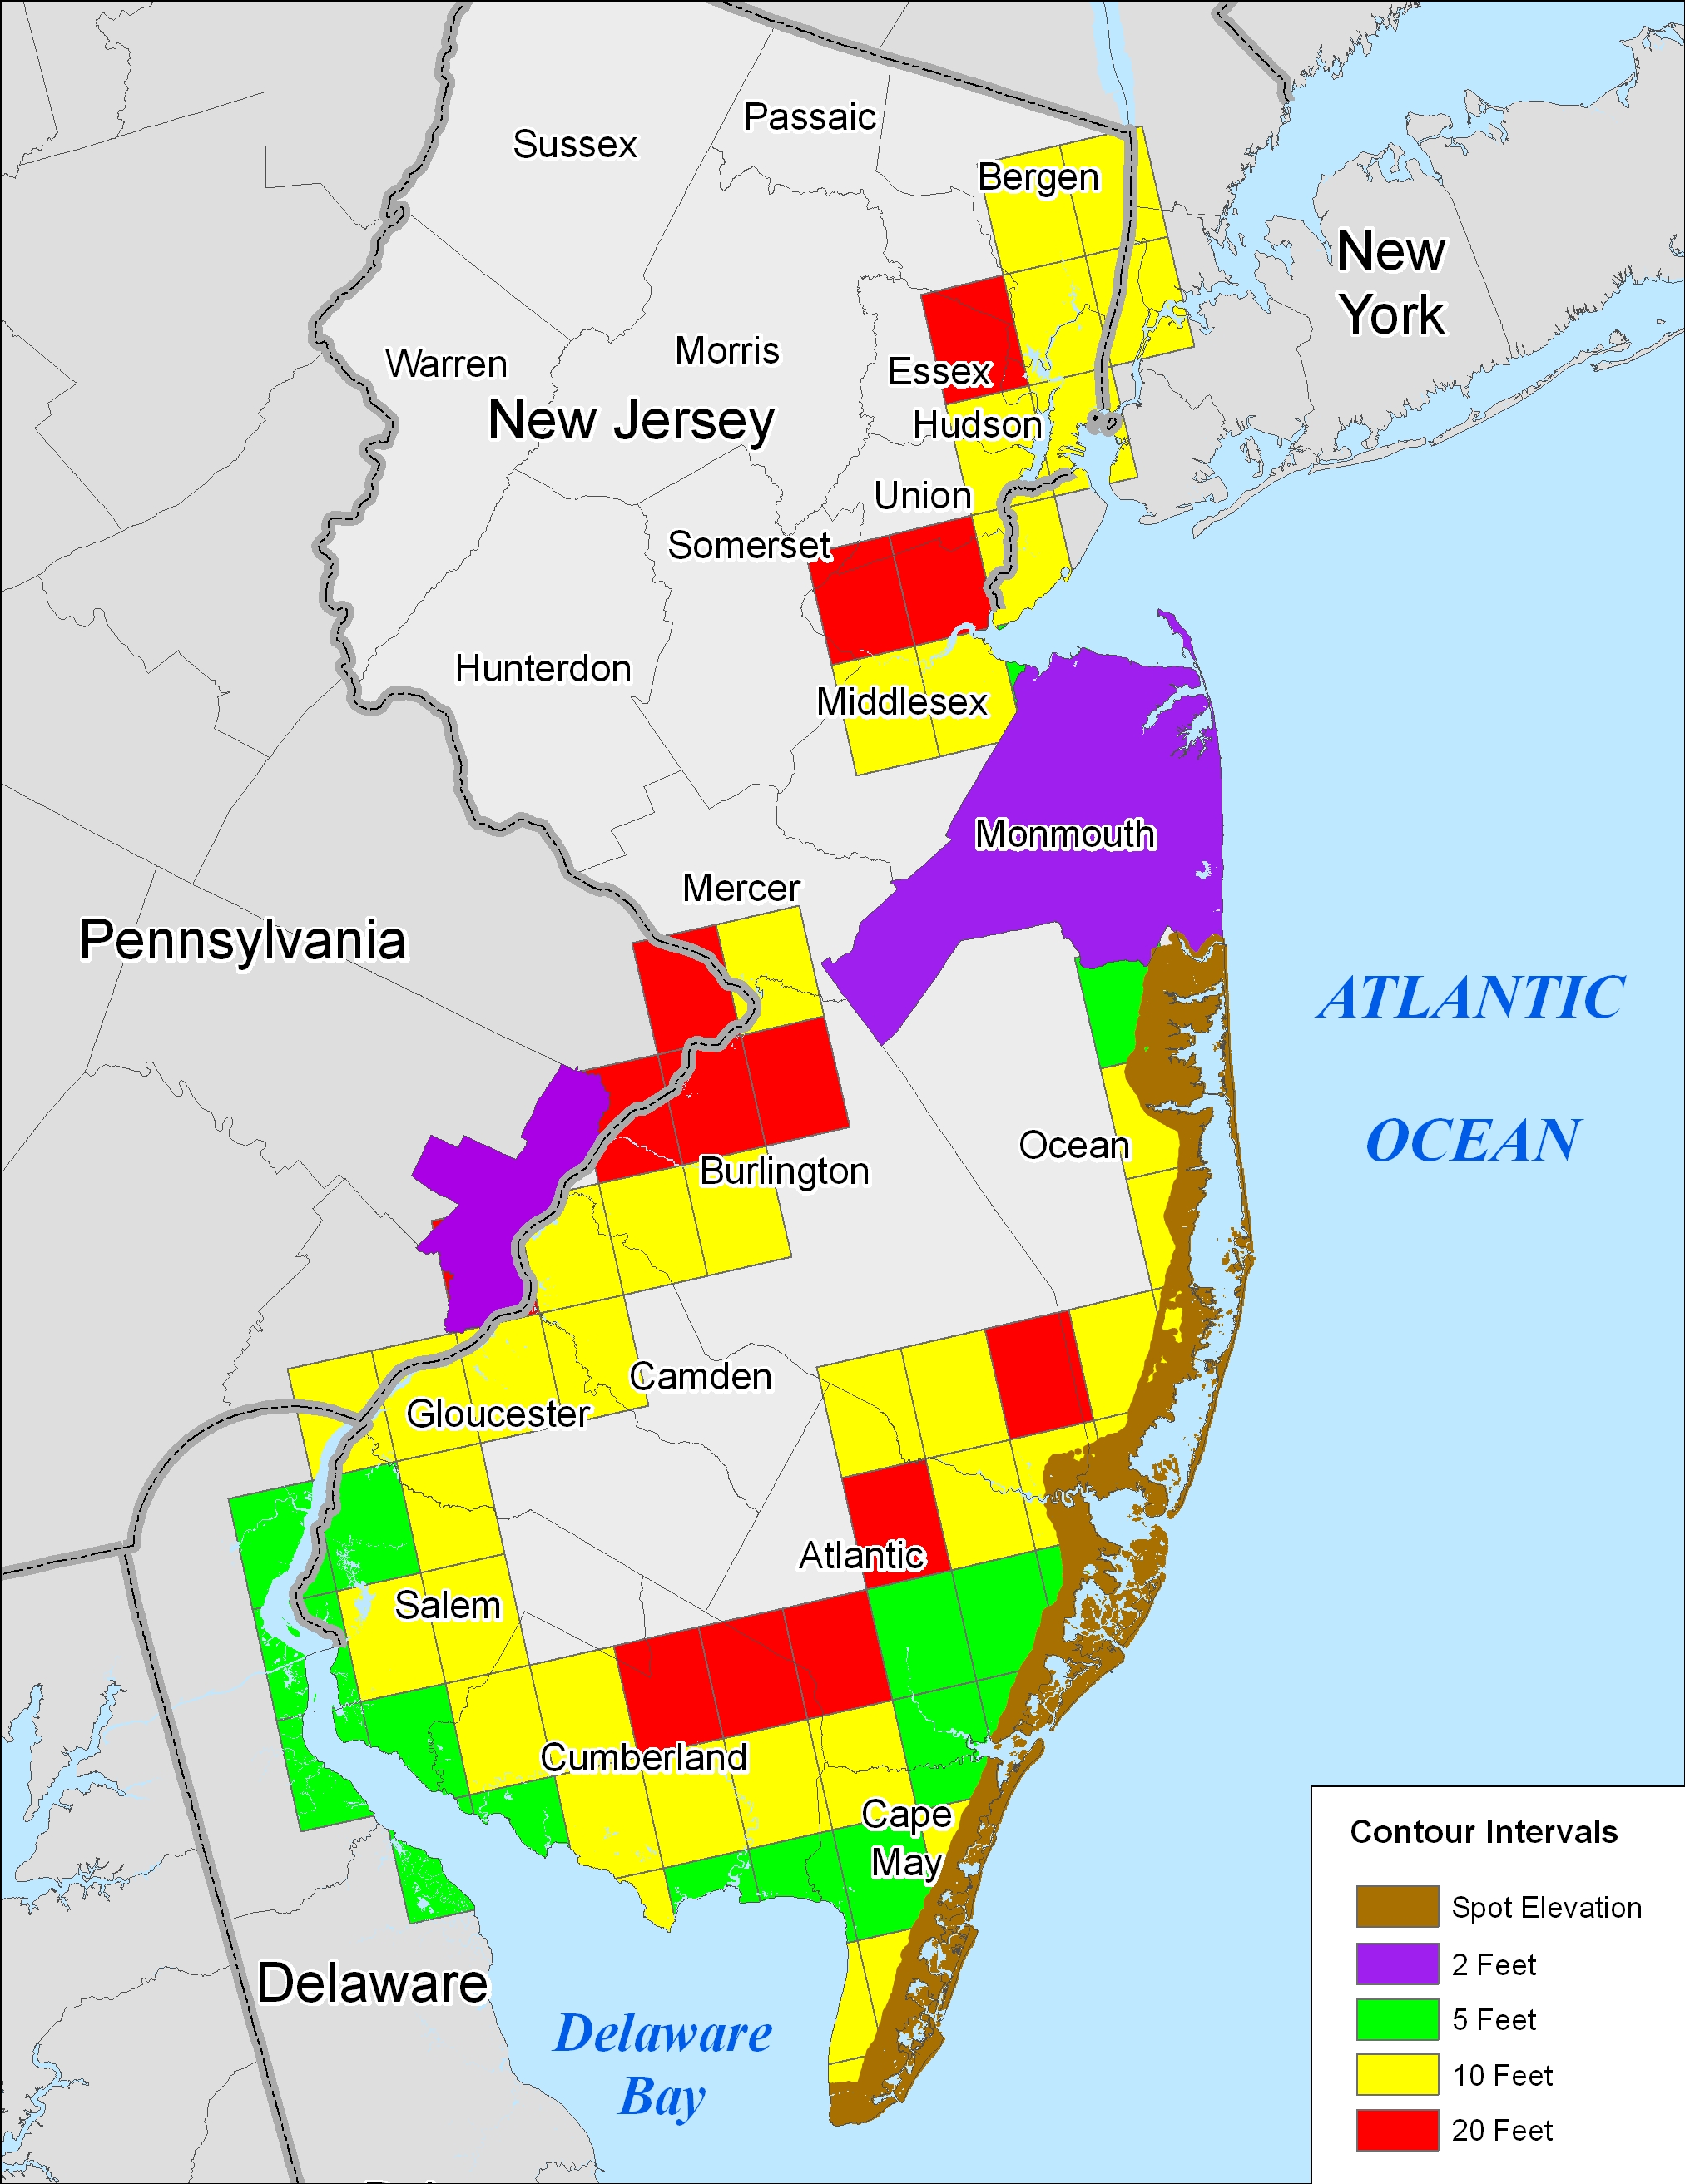
EPA estimates of the Area of Dry Land Close to Sea Level in New Jersey
The table below provides EPA's estimated uncertainty range of the area of dry land below particular elevations, in square kilometers. The uncertainty range considers the varying accuracy of the elevation data that the EPA study used. For example, Atlantic County has between 14 and 29 square kilometers of dry land within one meter above spring high water
The majority of land close to sea level is wetland rather than the dry land depicted in this table, so the EPA study also provided a table of the area of New Jersey wetlands vulnerable to sea level rise. A printer-friendly file with the area of dry land and wetland vulnerable to sea level rise in New Jersey is also available.
| ||||||||||||||||||||||||||||||||||||||||||||||||||||||||||||||||||||||||||||||||||||||||||||||||||||||||||||||||||||||||||||||||||||||||||||||||||||||||||||||||||||||||||||||||||||||||||||||||||||||||||||||||||||||||||||||||||||||||||||||||||||||||||||||||||||||||||||||||||||||||||||||||||||||||||||||||||||||||||||||||||||||||||||||||||||||||||||||||||||||||||||||||||||||||||||||||||||||||||||||||||||||||||||||||||||||||||||||||||||||||||||||||||||||||||||||||||||||||||||||||||||||||||||||||||||||||||||||||||||||||||||||||||||||||||||||||||||||