Maps of Lands Close to Sea Level: New York to Virginia
Contour Interval: 1 meter
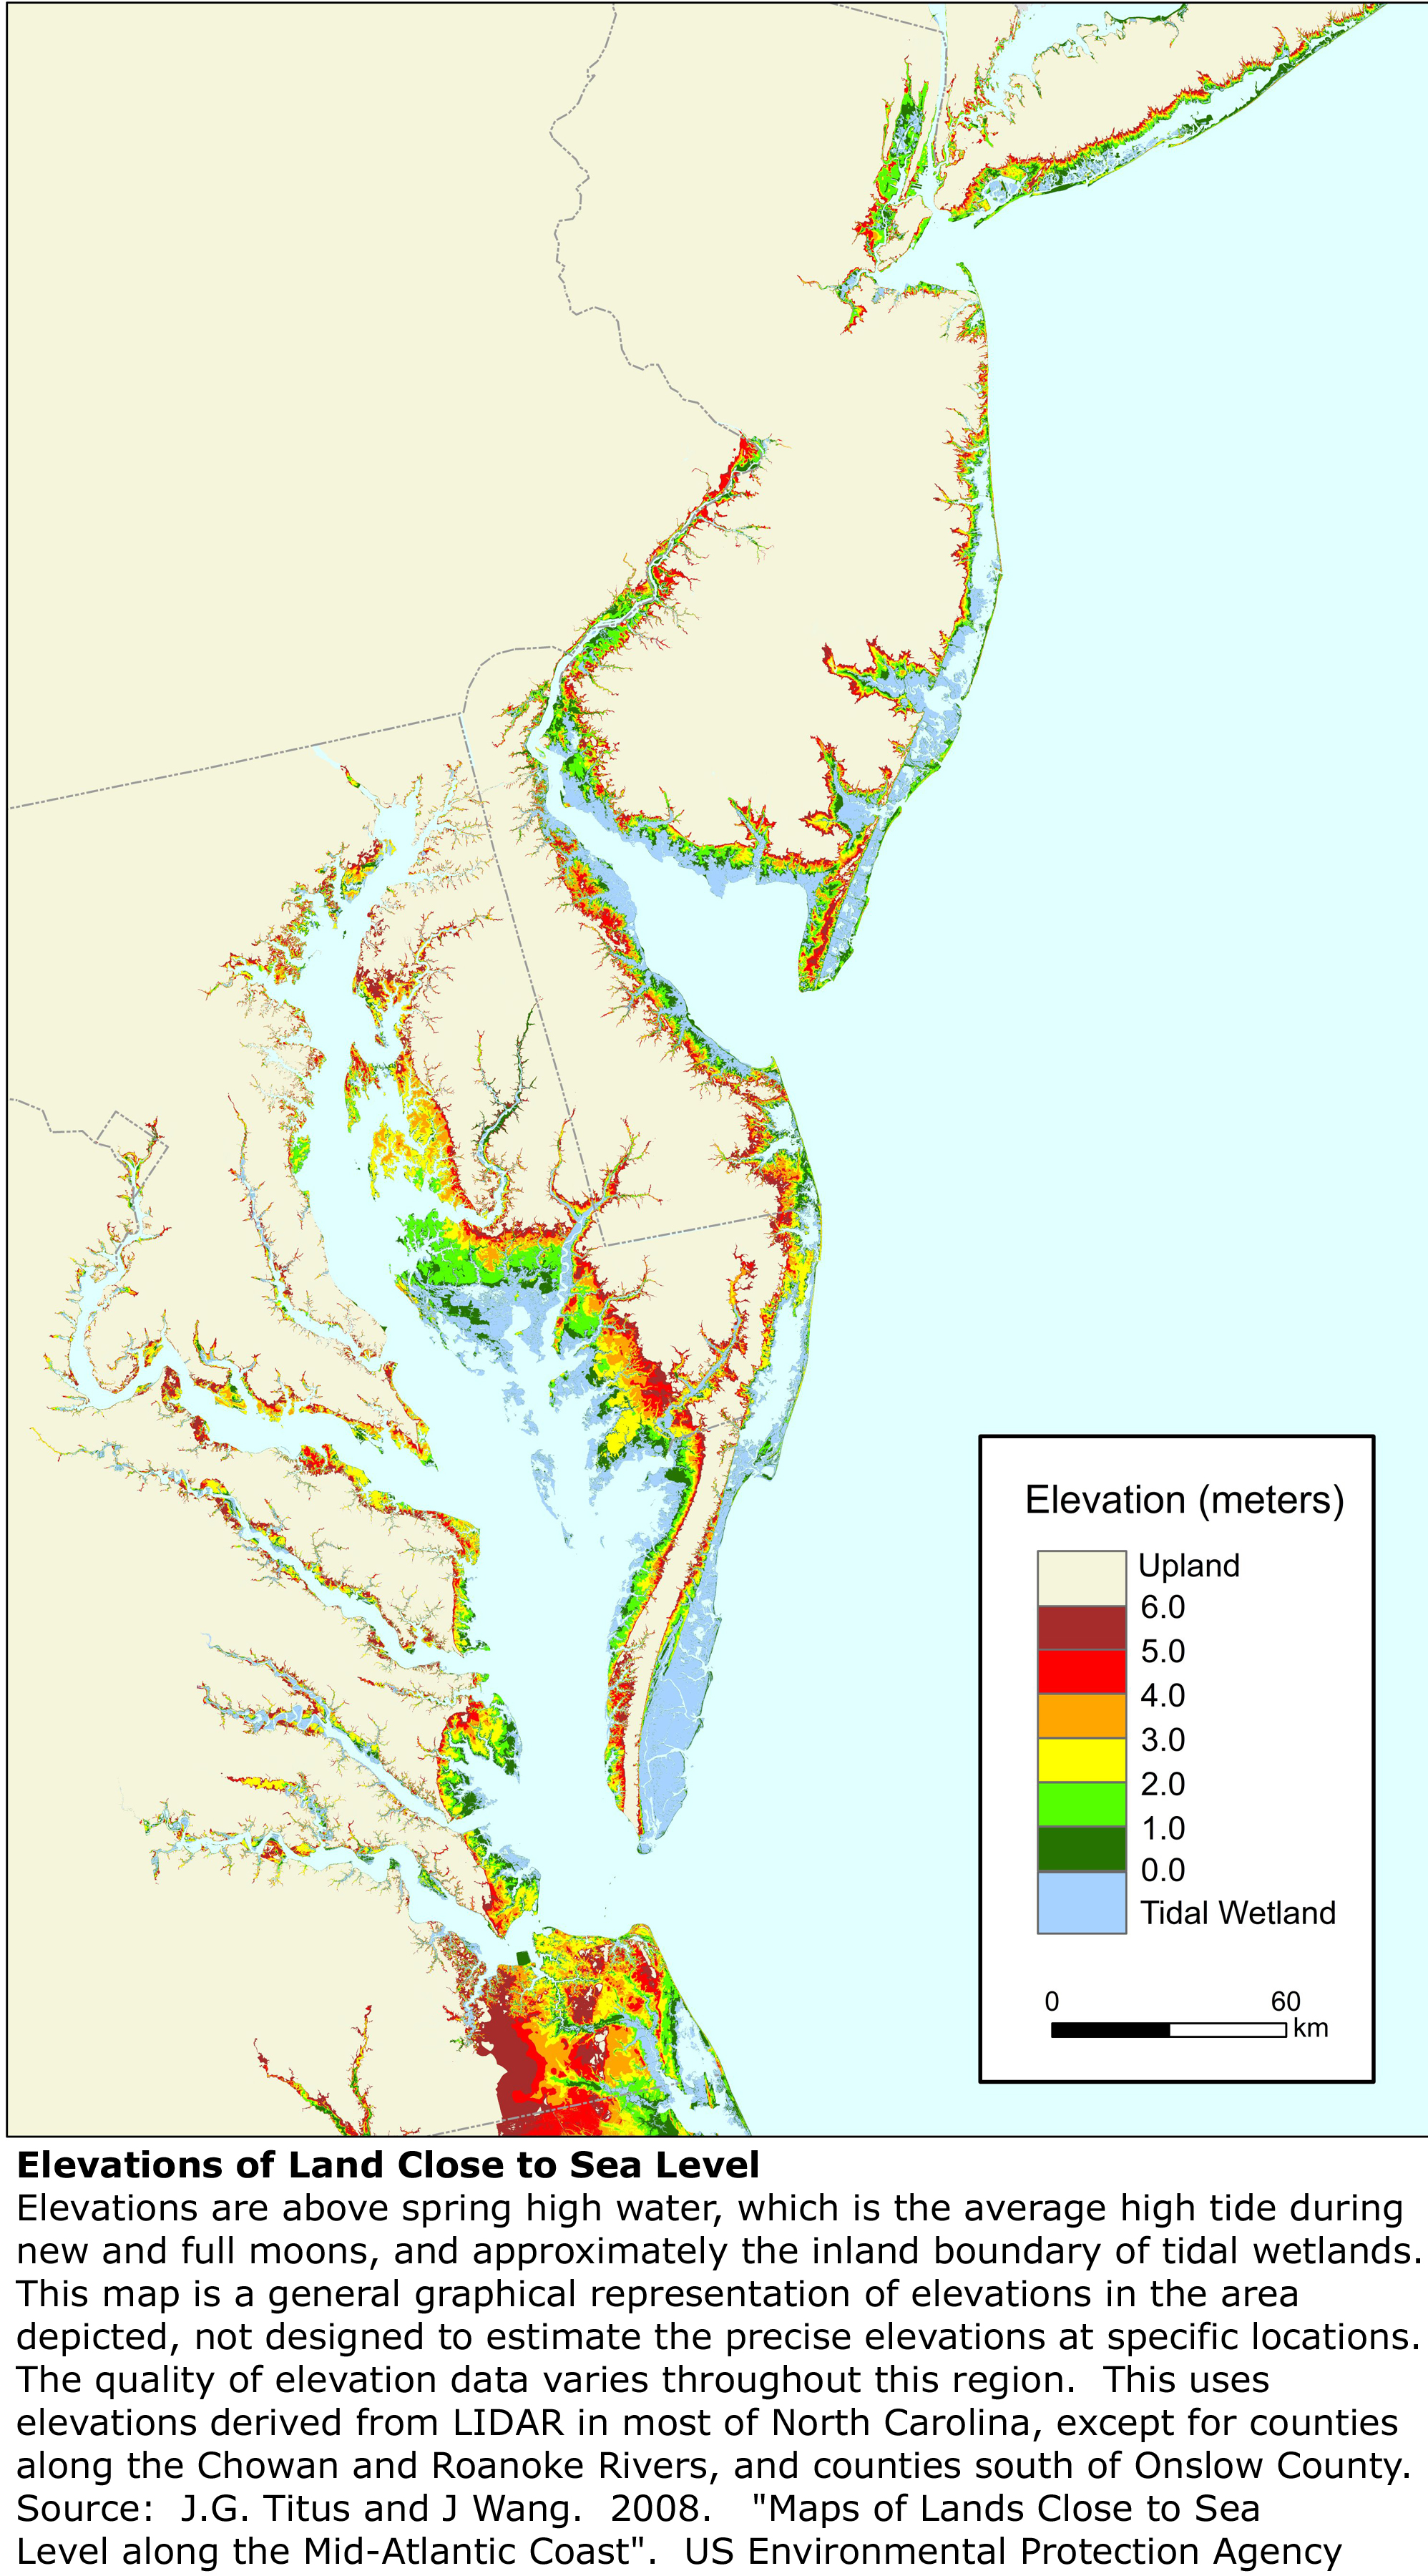
Download print quality version of the Mid-Atlantic elevation map.
We also have a map of the same area with a 50-cm contour interval that differentiates dry land from non-tidal wetlands